English    |    Français

Seven Great Experiments Using the Wireless CO2 Sensor

Measuring Carbon Dioxide (CO2) has many applications in the classroom and with the latest advances in technology is easier and more affordable than ever before. Here’s a quick look at some of the cool things you can do with the new Wireless CO2 Sensor!

1. Monitor Air Quality

An engaging way to introduce students to the sensor is to use the “closed” environment that you already have access to – your classroom or lab. This is also a great opportunity to use the data logging capabilities of the sensor. Find a central place in the room to place the sensor, ideally suspended above students heads where they can’t exhale onto the sensor. Place the sensor into logging mode, and collect 8-10hrs of data (Figure 1a). Depending on the student density in your room, HVAC, how closed the environment is, you should be able to see fluctuations in the CO2 levels that correspond to the class schedule because all of those students are busy breaking down glucose and producing CO2.
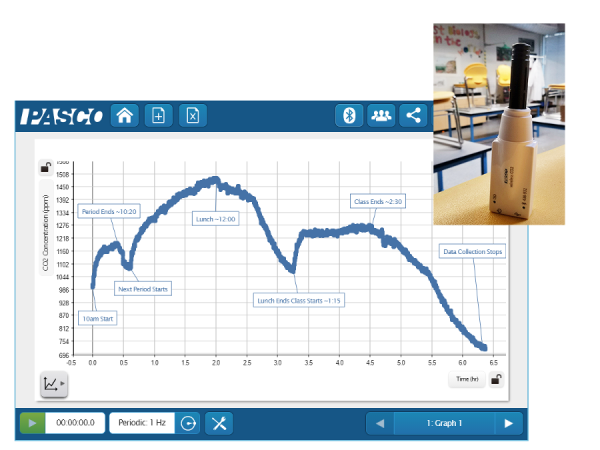

Figure 1a. Data from sensor logging over a school day.


Students can repeat this test in other locations such as the cafeteria, greenhouse, bathrooms, etc. While there are conflicting standards generally a CO2 concentration of <1,000ppm is desirable and >3,500ppm people will begin to experience physiological effects. Many modern HVAC systems even have their own sensors that will cycle the air to maintain CO2 levels <1,500ppm you can probably tell from the data if you your school or lab has one!
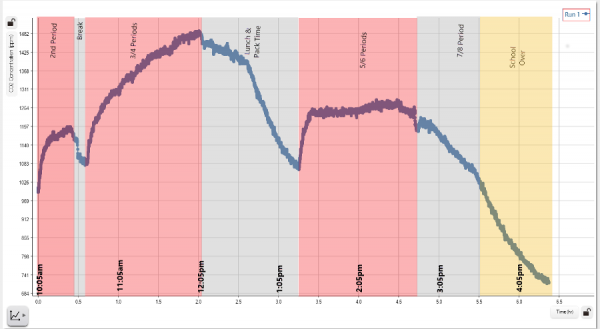

Figure 1b. Data with bell schedule overlaid


2. Investigate Cellular Respiration

With the included sample bottle students’ can use invertebrates, germinating seeds, or other small organisms to quickly collect respiration data. Variation in environmental factors like light or temperature provide easy extensions as well as germination time, species comparisons, body mass, activity level, etc.
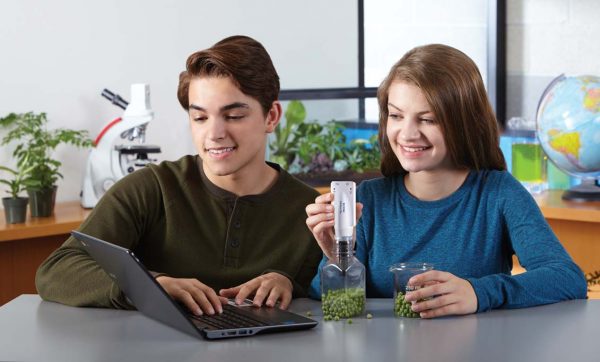

Figure 2. Respiration of Germinating Seeds


Extending this setup the sensor can be used with bacterial or yeast solutions, even aquatic species by measuring the gas concentration in the headspace of the container.
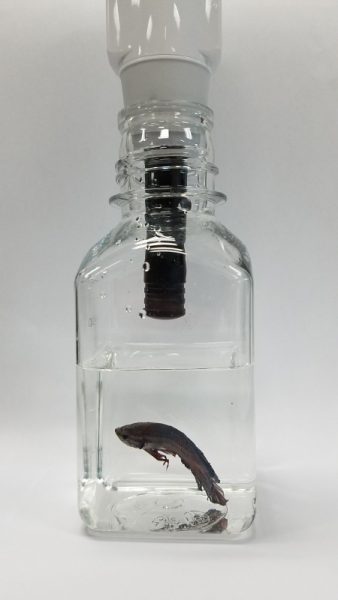

Figure 3. Headspace Measurement above a liquid


While a smaller chamber will yield faster results (gas concentration will change faster) sometimes a bigger chamber is needed to study larger organisms or when modeling ecosystems. This is where the wireless design is particularly helpful, the sensor can easily be placed inside any container along with the organism being studied – without any modifications. If you need to run the sensor for longer than about 18hrs, connect it to an external USB power pack or source and the sensor can continue working.
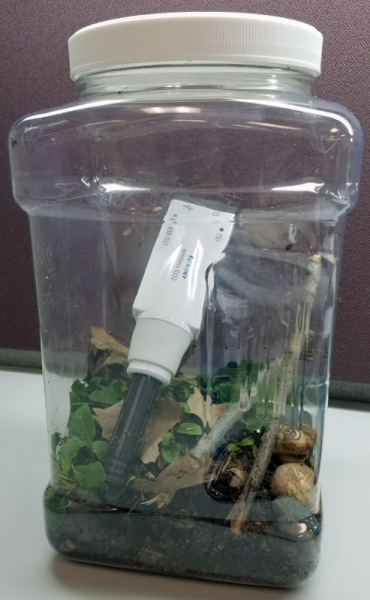

Figure 4. Sensor inside a larger food storage container


3. Investigate Photosynthesis

To get great photosynthesis data you just need a fresh dark green leaf, the sensor, and the sample bottle. Put the leaf in the bottle, cap it with the sensor and start data collection! Using the sample bottle and a fresh leaf ensures a quick response – data runs of 5-10min! Light vs. Dark and wavelength are simple and relevant manipulations for students to conduct.
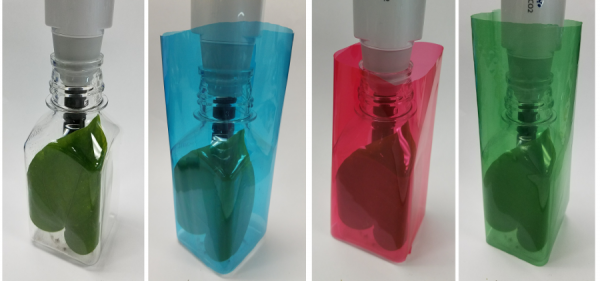

Figure 5. Photosynthesis using a single Epipremnum sp. Leaf with no filter, blue filter, red, and green applied. Plants exposed to full spectrum CFL bulb for 10min runs.


Test

CO2 Rate (ppm/min)

Light (no filter)

-17

Blue Filter

-7

Red Filter

-9

Green Filter

-12

Dark (tinfoil wrapped)

+32

Table 1. Summary of change in rate found from each run of data.


And more ideas (than I have time to test): Light intensity, impact of temperature, herbivory, time of day, herbicide impact, stomata density, C3/C4/CAM Plant comparison, CO2 Concentration

4. Measure Carbon Flux in the Field

In some cases lab experiments aren’t feasible or desirable. It’s easy to take the sensor into the field using a cut bottle, bell jar, or plastic bag to isolate a plant or patch of soil for analysis without disturbing the environment. Firmly press the container into the substrate to create a tight seal and begin collecting data. Students can easily compare different ecosystems to determine if they are a net carbon producer or consumer under conditions. This technique can be repeated in different conditions, times of the day or year to compare results.
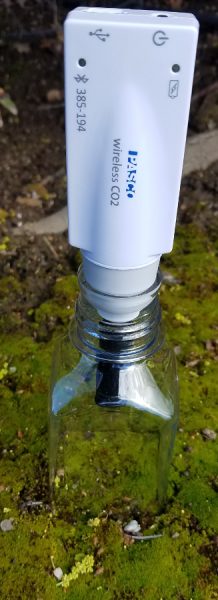

Figure 6. Cut bottle with sensor place over patch of turf


This same technique combined with the concept of measuring a headspace over a liquid to determine the gas exchange can be used to monitor carbon flux in an aquatic ecosystem. Securing the sensor with a float (or to a fix object) to protect it creates the airspace needed to measure above the water. Collect data for the day to see how a body of water is exchanging carbon with the atmosphere.
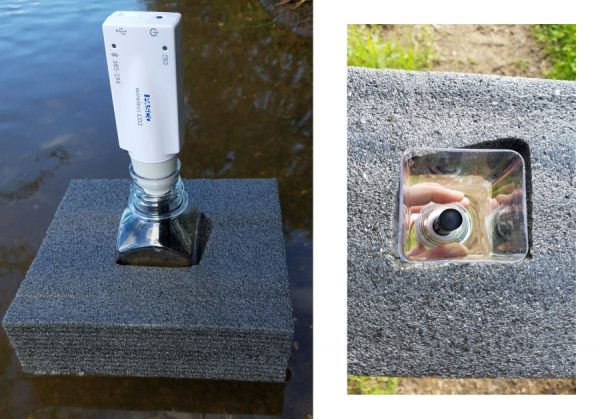

Figure 7. Using a float and cut bottle to create an airspace and measure carbon exchange


5. Monitor Respiration of Soil Microbes and Decomposers

To streamline the sample collection and measurement of soil samples students can use a section of PVC to collect a consistent volume of substrate and make the measurement in the same chamber. A 6-8in (15-20cm) section of pipe with an inner diameter of ~1.125” (3cm) can be easily pounded into the ground a specified depth to collect the sample. Seal the end of the pipe with some parafilm or plastic wrap and collect the data.
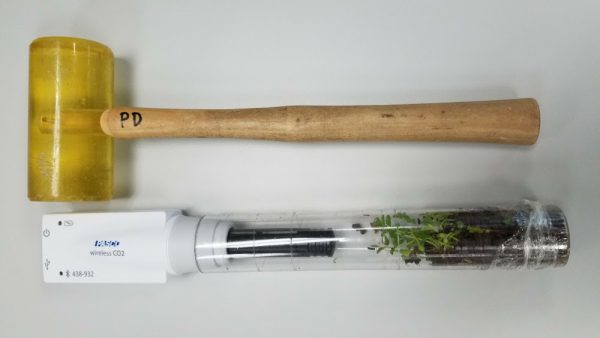

Figure 8. Sensor in PVC tube with marking for soil sample depth, clear PVC used to demonstrate


Data collection can take place in the field or lab and is easily extended for inquiry. Students can treat the samples with pH buffers, water, drying, salt, pesticides, or other chemicals of interest to determine the impact on microbe respiration.

6. Measure Human Respiration

Using a drinking straw and a 1gal (4L) ziplock® bag its easy to capture human respiration data. Here’s a video comparing breath hold time. This same procedure can be used to test other variables, before and after exercise, time of day, etc.


7. Dissolved CO2 in situ

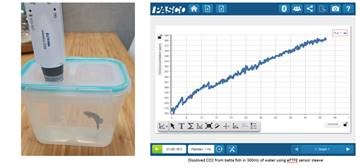
With Dissolved CO2 Sleeve students can monitor CO2 in an aquatic environment. The Teflon® material is permeable to CO2 molecules but not to water, creating a much smaller headspace around the sensor with a better response time. While the CO2 is not dissolved when its measured this approach has been validated and tracks with other indicators such as pH (Johnson et al 2010). This approach works well in the field and in the lab for photosynthesis and respiration experiments. Below is a picture and some data we collected during betta testing!

Reference:
Johnson, M. S., Billett, M. F., Dinsmore, K. J., Wallin, M. , Dyson, K. E. and Jassal, R. S. (2010), Direct and continuous measurement of dissolved carbon dioxide in freshwater aquatic systems – method and applications. Ecohydrol., 3: 68-78. doi:10.1002/eco.95
Related Products:

SPARKVUE – A resource for planning lessons during the pandemic!

With SPARKvue it is possible for teachers to collect data and steam the data to students in real time via a student device also running SPARKvue. This is possible if each device has SPARKvue loaded on it and is connected to WiFi – even if the devices are located many kms apart. So a teacher could schedule a zoom session with his/her students. Students could use a computer for this activity. The teacher could then carry out an activity on another device loaded with SPARKvue and stream this to students who would have a second device such as a tablet, chromebook or smart phone to receive the data. After using the zoom platform for some preliminary discussion the teacher could then turn control of the data over to each individual student and this student could then use all of the tools available to him/her in SPARKvue to carry out the analysis.

Has it been difficult for you to plan lessons for your students that would result in meaningful learning as they tackled them at home?

SPARKvue data collection software can be a great help here for several reasons:

  •  SPARKvue will run on a great variety of devices including smart phones, tablets, chromebooks, and computers. It is free for all of these devices except for computers, for which a license must be purchased.
  • The appearance and function of SPARKvue software is virtually identical ascross platforms.
    • An activity planned and carried out and saved on one device such as a tablet can be opened in another device such as a chromebook.
    • All of Pasco’s sensors can be used with any of these devices

  • Unlike the software of some of our competitors, it is possible to generate a number of pages in SPARKvue (actually there is no limit). This makes it possible to use a number of the displays available in SPARKvue such as a digital picture, a video clip, a graph, a table, a meter, a digital display, an assessment, a text box, and blockly coding.
  • A teacher could design and carry out an activity where most of the analysis is left for the student to complete. For example the sequence of pages could look as follows:
    • The opening page is a title page and gives a brief description of the task to be completed
    • Page 2 shows a digital photograph of the setup to be used
    • Page 3 contains a short video clip in which the teacher gives a brief explanation or where a specific technique is demonstrated – eg how to connect a pressure sensor to a syringe (for a Boyle’s Law activity).
    • Page 4 is a text box which informs students that a data run has been collected by the teacher and the following pages will instruct them how to analyze the results. For example on page 5 the page is split into two parts with the larger part on the left. Students are asked to generate a graph of the data. On the right side there are a number of questions which students must answer by analyzing the graph. This means that the students will have to know how to use the analysis tools found as part of the graph display.
    • On page 6 students could find another split page. Suppose a motion sensor was used to collect data. On the left side students could be asked to plot a graph of kinetic energy vs time. This means they would have to know how to use the calculator in SPARKvue. On the right side of the page there could be a number of questions relating to this graph.
  • SPARKvue can collect data from more than one sensor at a time. For example, an activity could be carried out in which the pH and temperature of a sample of orange juice is measured when AlkaSeltzer is added. Students could be asked to generate a graph showing both the temperature and pH of the juice as the reaction proceeds and then be asked a series of questions on this reaction.
    • As can be seen from the examples above SPARKvue can be used to carry out extensive analysis of collected data.

PASCO Wins Three “Best of Show” Awards from NSTA and Catapult-X

Wireless Smart Cart, Wireless Spectrometer, and Wireless Weather Sensor


We are pleased to announce that PASCO has been awarded three “Best of Show” awards! More than two thousand science and STEM educators participated in the first Science Educators’ Best of Show™ Awards by casting their votes for products that they felt impacted science learning. We are honored to have our products recognized in a competition designed by science educators for science educators. You can check out the winners below!

Category: Best New Technology Innovation for STEM
Winner: PASCO’s Wireless Smart Cart and Accessories
When physics educators combine the PASCO Wireless Smart Cart with the available accessories, they have a complete platform for demonstrating some of the toughest topics in mechanics. The Smart Cart’s ease of use and extensive capabilities allow students to perform their mechanics labs to a high degree of accuracy and repeatability. With sensors for position, velocity, acceleration, force, and rotation, the Wireless Smart Cart relays live data to help students test their understanding of mechanics in real time.

The wireless nature of the PASCO Wireless Smart Cart and Accessories is a definite improvement [over traditional systems]. The removal of wires needed to connect to an external interface makes data more accurate and opens up opportunity for more innovative experimentation. The accessories for the carts also are very innovative and extend the scope of investigation.

— Science Educators’ Best of Show Judge

Category: Best Tried & True Technology Teaching and Learning: Chemistry
Winner: The Wireless Spectrometer and Spectrometry software
With measurements for emission spectra, intensity, absorbance, transmittance, and fluorescence, the Wireless Spectrometer is surely more powerful than its size suggests. Its visual, user-centered design makes it easy for educators and leaners of all levels to integrate spectrometry into their learning. The key is PASCO’s Spectrometry software, which allows students to quickly generate standard curves, make comparisons, and analyze their results using its visual absorbance display. When combined, the Wireless Spectrometer and Spectrometry software provide educators with a classroom-friendly spectrometry solution that can be applied to a wide variety of chemistry topics.

This device provides advanced analysis potential of spectrum analysis for chemistry, environmental and physics classes that is quite rare for high school classes to experience. The data collection is quick and thorough with excellent software for analysis on many devices. Use of this device and software will enhance learning in many science courses.

— Science Educators’ Best of Show Judge

Category: Best Tried & True Technology Teaching and Learning: Environmental Science
Winner: The Wireless Weather Sensor and SPARKvue software
With more than nineteen different measurements, including GPS, the Wireless Weather Sensor supports real-world environmental investigations that relate phenomena to data collection and analysis within SPARKvue. Together, the Wireless Weather Sensor and weather features within SPARKvue create a coherent solution for performing both long-term and short-term environmental inquiry at any science level. The Weather Dashboard within SPARKvue intuitively displays live and logged data, while SPARKvue’s ArcView GIS mapping integration supports geospatial investigations and analysis.

This sensor would provide extra opportunities for data collection in environmental science. It does offer a variety of options for experimental situations-19 in all. Experiments can be of short duration or long term. The weather vane is mentioned as an extra device to enhance data collection.

— Science Educators’ Best of Show Judge


PASCO Scientific Joins the Google for Education Integrated Solutions Initiative

Jan 7th, 2020 — Roseville, CA
PASCO Scientific Joins the Google for Education Integrated Solutions Initiative

Roseville, Calif., Jan. 7, 2020 /PRNewswire/ — PASCO Scientific announced today that it has joined the Google for Education Integrated Solutions Initiative. This collaboration integrates PASCO solutions with Google products to improve the efficiency of classroom experimentation and science learning.

PASCO Scientific has collaborated with Google throughout the development process to deliver users a fluid experience. “Teachers and students have been using SPARKvue to collect and analyze data on their Chromebooks and Android devices for years. Partnering with Google feels like a natural step forward in our mission to provide educators with a centralized solution for teaching science. We plan to continue improving global access to science education and data literacy alongside Google,” said Richard Briscoe, President and CEO of PASCO Scientific.

The Google for Education Integrated Solutions Initiative features education apps and tools optimized for integration with Chrome OS, Google Classroom, or G Suite for Education. PASCO’s more than 55 years of experience in science education has made them a well-known leader in STEM education and an ideal partner for the advancement of powerful teaching and learning solutions.

The first set of integrations with Google’s offerings include the ability to connect PASCO sensors to the Google Science Journal app on Android, export data directly to Google Sheets on Android, and easily share lab resources from PASCO.com through Google Classroom.

The partnership extends accessibility to educators by providing them with an affordable and compatible sensor solution. Science Journal app users will now enjoy the same plug-and-play sensor experience as SPARKvue users when using PASCO wireless sensors. A new “Share to Classroom” button exports digital experiments from the PASCO Experiment Library to courses setup in Google Classroom. This feature enables educators to export any of PASCO’s free experiments to their entire class with a single click.

Briscoe is confident in the partnership’s potential saying, “At PASCO, we are excited to be partnering with Google in our mission to promote accessible science learning and data literacy. We are consistently striving to provide educators with innovative teaching solutions that improve the efficiency of their classroom. Hundreds of thousands of learners around the world use Google Science Journal. By enabling PASCO sensors to work with Google Science Journal, we are expanding educators’ tools and helping students engage with science learning.”

For more information about the integration of PASCO solutions into Google products, please visit www.pasco.com/resources/google.

Blockly Coding with PASCO Capstone and SPARKvue

Confidently Integrate Computational Thinking into Any Lesson with Blockly

Introducing students to coding and computer-controlled outcomes is easier than ever before with Blockly coding. Included in SPARKvue 4 and Capstone 2, Blockly offers students a new world of experimental opportunities that focus on computational thinking and data visualization. Blockly’s visual coding environment is intuitively designed to facilitate the success of new coders, while strengthening the skills of more advanced learners.

Blockly’s colored coding blocks provide students with a visual method for developing strong coding foundations. The user-friendly design allows students to simply drag and connect coding blocks that correlate with syntactically correct coding elements such as variables, commands, and loops.

Blockly within SPARKvue and Capstone is compatible with all PASCO sensors and interfaces. When students combine PASCO sensors with Blockly, they are empowered to design and execute their very own sensor experiments. Students can create code that collects sensor measurements, reports data, or controls output devices such as the Smart Fan Accessory. As they execute their code, students can visualize their data using real-time graphical displays that assist with data visualization.

Real-World Coding Activities: Computational Thinking Meets Data Literacy

The integration of Blockly into SPARKvue and Capstone gives students unparalleled control over their experiments. While developing their code, students can press the Record button at any time to execute it and receive live feedback. Students can instantly monitor sensor measurements through live graphs and digits displays that support debugging throughout their code creation process. Once students have successfully coded their sensor parameters, they can collect data in real time, store it, and use it to inform future experiments.

With an unlimited amount of coding combinations, Blockly allows students to customize and create experimental designs, determine data outputs, and use those outputs to inform future decisions. Through the integration of coding and sensor-based technology, both SPARKvue and Capstone provide a platform for the exploration of phenomena through computational thinking and data visualization.

Sample Programming Activities


Entry Level Programming with the Wireless pH Sensor

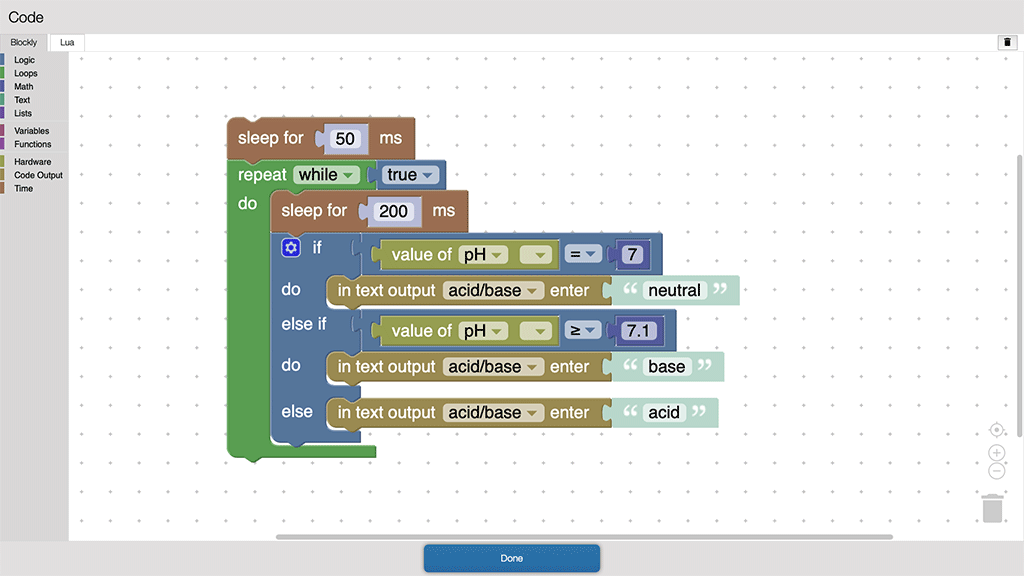
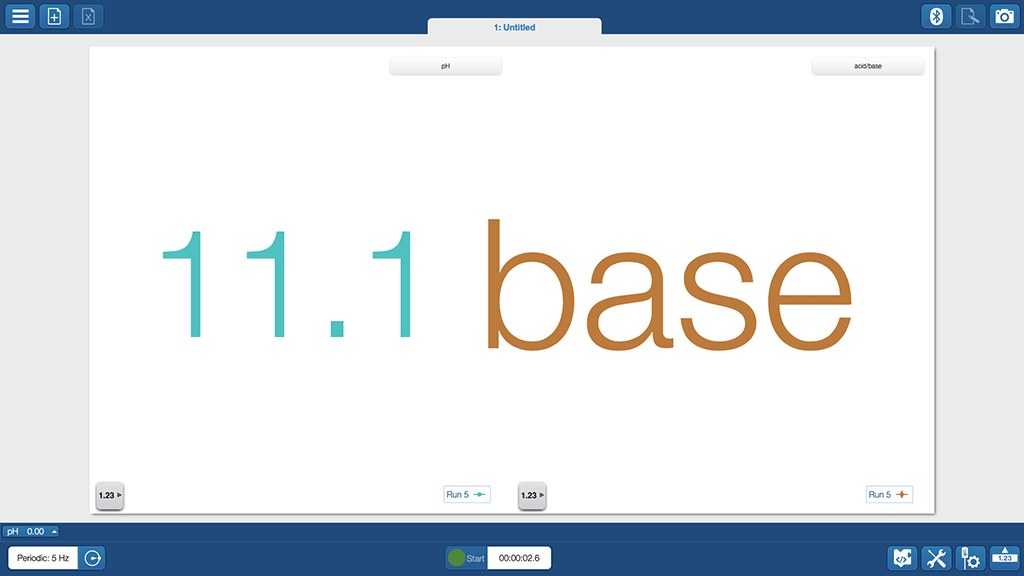
The Wireless pH Sensor is the perfect tool for introducing young learners to pH and simple programming. In this activity, students use their knowledge of the pH scale and a Wireless pH Sensor to create code that runs along with their data collection. Using a simple set of coding blocks, students can instruct the sensor to identify a sample solution as neutral, basic, or acidic. As their code is executed, live data displays communicate the code’s effect in real time. A text display will correctly identify a solution’s pH. This simple activity gently introduces students to basic programming concepts, sensor measurement, and the pH scale to instill a foundational sense of confidence and understanding in STEM.

SPARKvue Blockly Code
Instruct the sensor to identify a sample solution as neutral, basic, or acidic.
SPARKvue Blockly Code
A live data display communicates the code’s effect in real time.

Entry Level Programming with the Wireless Temperature Sensor

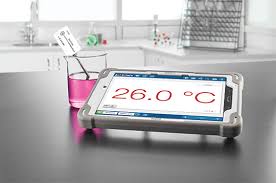
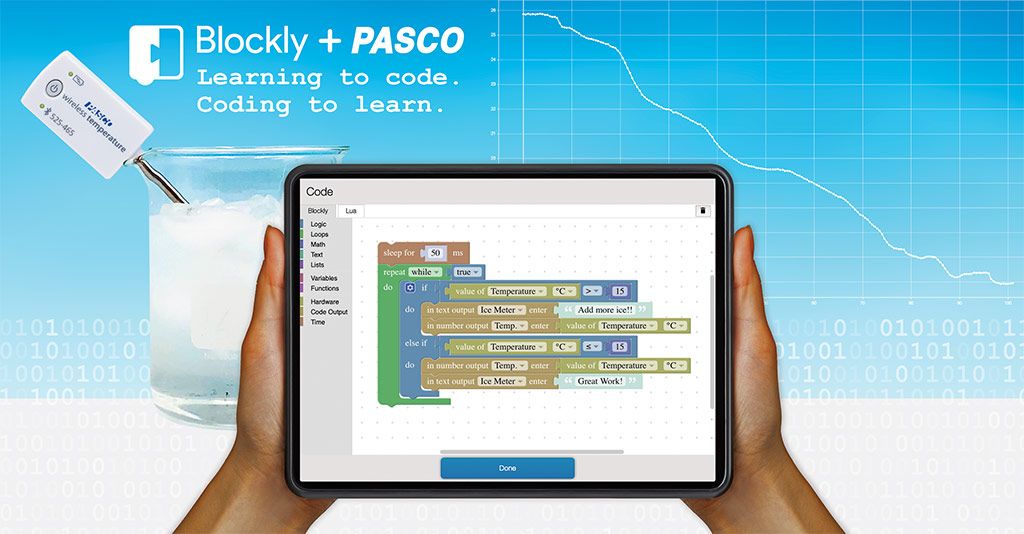
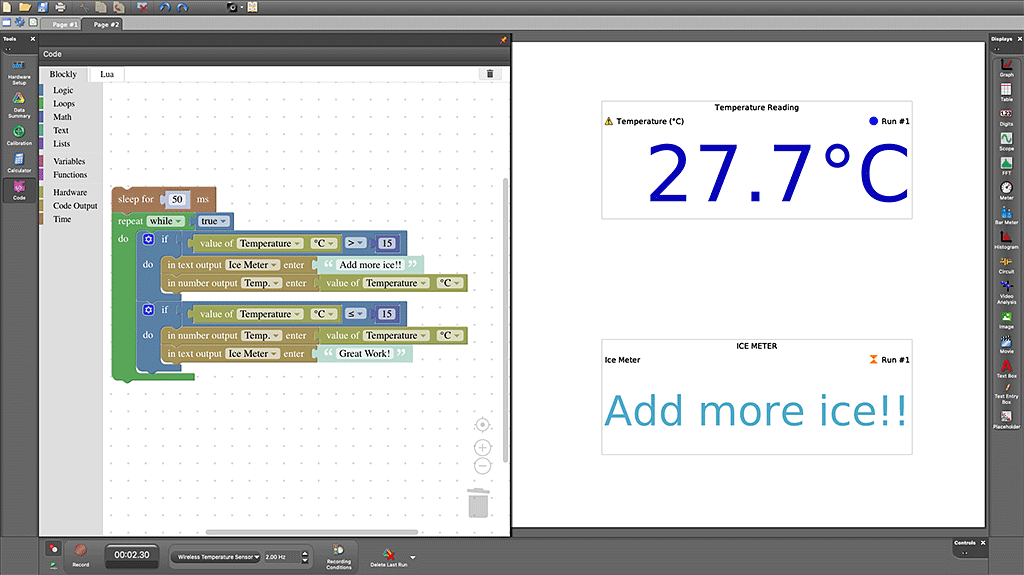
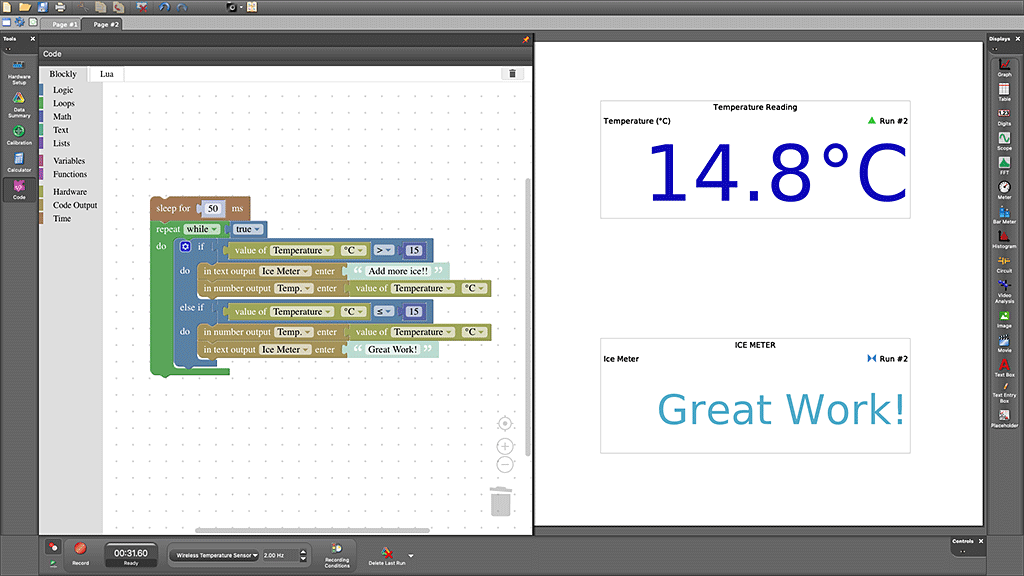
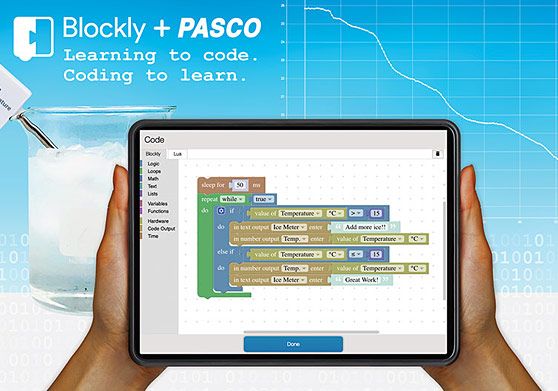
For introductory lessons, students can learn to program a temperature display and a simple text output. The goal of this activity is for students to create a program that gives instructions to cool a liquid to below 15°C. Students can monitor their live temperature reading and a text output that is temperature-dependent. In this example, the text output reads “Add more ice!” when the water temperature is above 15°C, and “Great work!!” when the water temperature is less than or equal to 15°C. The Wireless Temperature Sensor should be placed in a cup containing room temperature water. Once students have developed their Blockly code, they can execute it using the Record button. Add the ice gradually to reduce the water temperature. A successful program will display a live temperature reading and the correct text when the temperature shifts above and below 15°C.

Capstone Blockly Code
In this example, the text output reads “Add more ice!” when the water temperature is above 15°C.
Capstone Blockly Code
In this example, the text output reads “Great work!!” when the water temperature is less than or equal to 15°C.

Advanced Level Programming: Thrust with Blockly and the Smart Fan Accessory

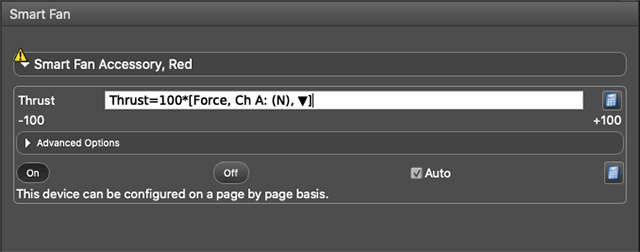
The patented Smart Fan Accessory adds versatility to any dynamics experiment. It features numerous control features when plugged into a Smart Cart. Students can control the fan’s thrust and direction from their devices. They can also set start and stop conditions that power the fan on or off when a particular measurement, such as position, reaches a set value. Students can easily determine a parameter and immediately observe its impact on the experimental outcome, which is a powerful component of active learning.

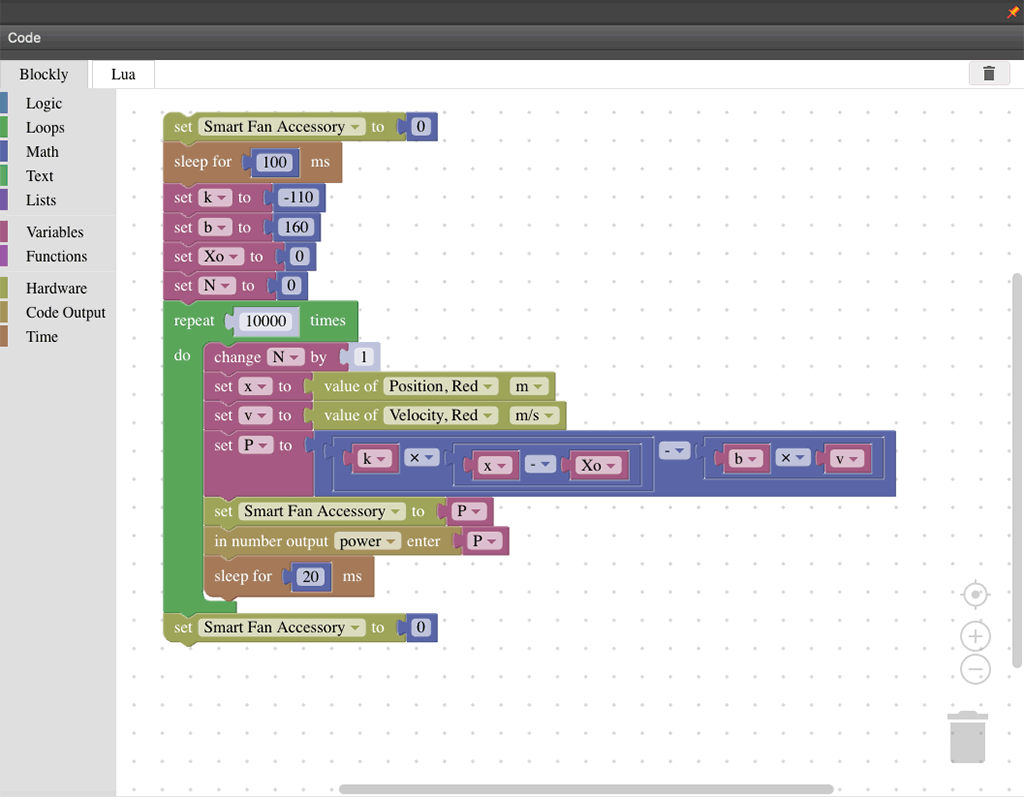
Students can control the fan’s thrust by programming calculations based on sensor measurements. In this example, a student commands the fan to maintain a thrust of -100*[Position]. This makes the fan blow harder as the cart moves down the track, causing the cart to reverse. When the fan senses a determined measurement, the student’s code is executed, producing a physical change in the experiment and altering data collection. Students can test their code’s effectiveness, make corrections, obtain live data, and complete graphical analysis before exporting their lab for grading. This user-friendly platform is an intuitive and time-efficient method for introducing students to computational thinking without straying from standards.

Smart Fan Configuration Menu
Control the fan’s thrust and direction from their devices.
Capstone Blockly Code
Control the fan’s thrust by programming calculations based on sensor measurements.

Blockly is Compatible with All PASCO Sensors & Interfaces

Get started with these favorites:


Data and Analysis

  • Organize and present collected data visually to highlight relationships and support a claim.
  • Use data to highlight or propose cause-and-effect relationships, predict outcomes, or communicate an idea.
  • Represent data using multiple encoding schemes.
  • Collect data using computational tools and transform the data to make it more useful and reliable.
  • Refine computational models based on the data they have generated.

Algorithms and Programming

  • Compare and refine multiple algorithms for the same task and determine which is the most appropriate.
  • Create programs that use variables to store and modify data.
  • Create programs that include sequences, events, loops, and conditionals.
  • Use an iterative process to plan the development of a program by including other perspectives and considering user preferences.
  • Test and debug (identify and fix errors) a program or algorithm to ensure it runs as intended.
  • Use flowcharts and/or pseudocode to address complex problems as algorithms.
  • Create clearly named variables that represent different data types and perform operations on their values.
  • Design and iteratively develop programs that combine control structure, including nested loops and compound conditionals.
  • Decompose problems and subproblems into parts to facilitate the design, implementation, and review of programs.

Computing Systems

  • Design projects that combine hardware and software components to collect and exchange data.

Motion and Stability: Forces and Interactions

  • Plan and conduct an investigation to provide evidence of the effects of balanced and unbalanced forces on the motion of an object.
  • Define a simple design problem that can be solved by applying scientific ideas about magnets.
  • Ask questions to determine cause and effect relationships of electric or magnetic interactions between two objects not in contact with each other.
  • Conduct an investigation and evaluate the experimental design to provide evidence that fields exist between objects exerting forces on each other even though the objects are not in contact.

Energy

  • Make observations to provide evidence that energy can be transferred from place to place by sound, light, heat, and electric currents.

Waves and Their Applications in Technologies for Information Transfer

  • Generate and compare multiple solutions that use patterns to transfer information.
  • Integrate qualitative scientific and technical information to support the claim that digitized signals are a more reliable way to encode and transmit information than analog signals.

Engineering Design

  • Generate and compare multiple possible solutions to a problem based on how well each is likely to meet the criteria and constraints of the problem.
  • Plan and carry out fair tests in which variables are controlled and failure points are considered to identify aspects of a model or prototype that can be improved.
  • Analyze data from tests to determine similarities and differences among several design solutions to identify the best characteristics of each that can be combined into a new solution to better meet the criteria for success.
  • Develop a model to generate data for iterative testing and modification of a proposed object, tool, or process such that an optimal design can be achieved.


Confidently Integrate Computational Thinking into Any Lesson with Blockly

Introducing students to coding and computer-controlled outcomes is easier than ever before with Blockly coding. Included in SPARKvue 4 and Capstone 2, Blockly offers students a new world of experimental opportunities that focus on computational thinking and data visualization. Blockly’s visual coding environment is intuitively designed to facilitate the success of new coders, while strengthening the skills of more advanced learners.

Blockly’s colored coding blocks provide students with a visual method for developing strong coding foundations. The user-friendly design allows students to simply drag and connect coding blocks that correlate with syntactically correct coding elements such as variables, commands, and loops.

Blockly within SPARKvue and Capstone is compatible with all PASCO sensors and interfaces. When students combine PASCO sensors with Blockly, they are empowered to design and execute their very own sensor experiments. Students can create code that collects sensor measurements, reports data, or controls output devices such as the Smart Fan Accessory. As they execute their code, students can visualize their data using real-time graphical displays that assist with data visualization.

Real-World Coding Activities: Computational Thinking Meets Data Literacy

The integration of Blockly into SPARKvue and Capstone gives students unparalleled control over their experiments. While developing their code, students can press the Record button at any time to execute it and receive live feedback. Students can instantly monitor sensor measurements through live graphs and digits displays that support debugging throughout their code creation process. Once students have successfully coded their sensor parameters, they can collect data in real time, store it, and use it to inform future experiments.

With an unlimited amount of coding combinations, Blockly allows students to customize and create experimental designs, determine data outputs, and use those outputs to inform future decisions. Through the integration of coding and sensor-based technology, both SPARKvue and Capstone provide a platform for the exploration of phenomena through computational thinking and data visualization.

Sample Programming Activities


Entry Level Programming with the Wireless pH Sensor

The Wireless pH Sensor is the perfect tool for introducing young learners to pH and simple programming. In this activity, students use their knowledge of the pH scale and a Wireless pH Sensor to create code that runs along with their data collection. Using a simple set of coding blocks, students can instruct the sensor to identify a sample solution as neutral, basic, or acidic. As their code is executed, live data displays communicate the code’s effect in real time. A text display will correctly identify a solution’s pH. This simple activity gently introduces students to basic programming concepts, sensor measurement, and the pH scale to instill a foundational sense of confidence and understanding in STEM.

SPARKvue Blockly Code
Instruct the sensor to identify a sample solution as neutral, basic, or acidic.
SPARKvue Blockly Code
A live data display communicates the code’s effect in real time.

Entry Level Programming with the Wireless Temperature Sensor

For introductory lessons, students can learn to program a temperature display and a simple text output. The goal of this activity is for students to create a program that gives instructions to cool a liquid to below 15°C. Students can monitor their live temperature reading and a text output that is temperature-dependent. In this example, the text output reads “Add more ice!” when the water temperature is above 15°C, and “Great work!!” when the water temperature is less than or equal to 15°C. The Wireless Temperature Sensor should be placed in a cup containing room temperature water. Once students have developed their Blockly code, they can execute it using the Record button. Add the ice gradually to reduce the water temperature. A successful program will display a live temperature reading and the correct text when the temperature shifts above and below 15°C.

Capstone Blockly Code
In this example, the text output reads “Add more ice!” when the water temperature is above 15°C.
Capstone Blockly Code
In this example, the text output reads “Great work!!” when the water temperature is less than or equal to 15°C.

Advanced Level Programming: Thrust with Blockly and the Smart Fan Accessory

The patented Smart Fan Accessory adds versatility to any dynamics experiment. It features numerous control features when plugged into a Smart Cart. Students can control the fan’s thrust and direction from their devices. They can also set start and stop conditions that power the fan on or off when a particular measurement, such as position, reaches a set value. Students can easily determine a parameter and immediately observe its impact on the experimental outcome, which is a powerful component of active learning.

Students can control the fan’s thrust by programming calculations based on sensor measurements. In this example, a student commands the fan to maintain a thrust of -100*[Position]. This makes the fan blow harder as the cart moves down the track, causing the cart to reverse. When the fan senses a determined measurement, the student’s code is executed, producing a physical change in the experiment and altering data collection. Students can test their code’s effectiveness, make corrections, obtain live data, and complete graphical analysis before exporting their lab for grading. This user-friendly platform is an intuitive and time-efficient method for introducing students to computational thinking without straying from standards.

Smart Fan Configuration Menu
Control the fan’s thrust and direction from their devices.
Capstone Blockly Code
Control the fan’s thrust by programming calculations based on sensor measurements.

Blockly is Compatible with All PASCO Sensors & Interfaces

Get started with these favorites:

Standards Alignment


ISTE Standard: Computational Thinker (all ages)

  • 5a Students formulate problem definitions suited for technology-assisted methods such as data analysis, abstract models and algorithmic thinking in exploring and finding solutions.
  • 5b Students collect data or identify relevant data sets, use digital tools to analyze them, and represent data in various ways to facilitate problem-solving and decision-making.
  • 5c Students break problems into component parts, extract key information, and develop descriptive models to understand complex systems or facilitate problem-solving.
  • 5d Students understand how automation works and use algorithmic thinking to develop a sequence of steps to create and test automated solutions.

ISTE Standards Grades 3-5 (ages 8-11)

Data and Analysis

  • 1B-DA-06 Organize and present collected data visually to highlight relationships and support a claim.
  • 1B-DA-07 Use data to highlight or propose cause-and-effect relationships, predict outcomes, or communicate an idea.

Algorithms and Programming

  • 1B-AP-08 Compare and refine multiple algorithms for the same task and determine which is the most appropriate.
  • 1B-AP-09 Create programs that use variables to store and modify data.
  • 1B-AP-10 Create programs that include sequences, events, loops, and conditionals.
  • 1B-AP-13 Use an iterative process to plan the development of a program by including other perspectives and considering user preferences.
  • 1B-AP-15 Test and debug (identify and fix errors) a program or algorithm to ensure it runs as intended.

ISTE Standards Grades 6-8 (ages 11-14)

Computing Systems

  • 2-CS-02 Design projects that combine hardware and software components to collect and exchange data.

Data and Analysis

  • 2-DA-07 Represent data using multiple encoding schemes.
  • 2-DA-08 Collect data using computational tools and transform the data to make it more useful and reliable.
  • 2-DA-09 Refine computational models based on the data they have generated.

Algorithms and Programming

  • 2-AP-10 Use flowcharts and/or pseudocode to address complex problems as algorithms.
  • 2-AP-11 Create clearly named variables that represent different data types and perform operations on their values.
  • 2-AP-12 Design and iteratively develop programs that combine control structure, including nested loops and compound conditionals.
  • 2-AP-13 Decompose problems and subproblems into parts to facilitate the design, implementation, and review of programs.

NGSS Alignment (Grades 3-5)

Motion and Stability: Forces and Interactions

  • 3-PS2-1 Plan and conduct an investigation to provide evidence of the effects of balanced and unbalanced forces on the motion of an object.
  • 3-PS2-4 Define a simple design problem that can be solved by applying scientific ideas about magnets.

Energy

  • 4-PS3-2 Make observations to provide evidence that energy can be transferred from place to place by sound, light, heat, and electric currents.

Waves and Their Applications in Technologies for Information Transfer

  • 4-PS4-3 Generate and compare multiple solutions that use patterns to transfer information.

Engineering Design

  • 3-5-ETS1-2 Generate and compare multiple possible solutions to a problem based on how well each is likely to meet the criteria and constraints of the problem.
  • 3-5-ETS1-3 Plan and carry out fair tests in which variables are controlled and failure points are considered to identify aspects of a model or prototype that can be improved.

NGSS Alignment (Grades 6-8)

Motion and Stability: Forces and Interactions

  • MS-PS2-3 Ask questions to determine cause and effect relationships of electric or magnetic interactions between two objects not in contact with each other.
  • MS-PS2-5 Conduct an investigation and evaluate the experimental design to provide evidence that fields exist between objects exerting forces on each other even though the objects are not in contact.

Waves and Their Applications in Technologies for Information Transfer

  • MS-PS4-3 Integrate qualitative scientific and technical information to support the claim that digitized signals are a more reliable way to encode and transmit information than analog signals.

Engineering Design

  • MS-ETS1-3 Analyze data from tests to determine similarities and differences among several design solutions to identify the best characteristics of each that can be combined into a new solution to better meet the criteria for success.
  • MS-ETS1-4 Develop a model to generate data for iterative testing and modification of a proposed object, tool, or process such that an optimal design can be achieved.

Independent (Remote) Datalogging

In logging mode, wireless sensors collect data to their onboard memory for hours, days, weeks or even months at a time without needing to be connected to a computer, tablet, Chromebook or smartphone.

When the experiment concludes, simply connect the sensor to a device running PASCO software and download all the measurements it recorded.

How much does a windshield screen affect the temperature inside a car on a hot day? Using Wireless Temperature Sensors in logging mode makes it easy to find out.


Set up remote logging

Collect data directly on a Wireless Sensor instead of a computer or mobile device.

Note: Remote Logging is only available for PASCO Wireless Sensors.

  1. Open SPARKvue or click then select Start New Experiment.
  2. Click Remote Logging:
  3. Turn on the sensor then click the sensor which matches the device ID.

  4. Configure remote logging for each sensor:
      1. Select a sensor to configure from the Sensor menu.
      2. Toggle Sensor Enabled to Off if you don’t want to log data with this sensor.
      3. Set the Sample Rate using the left and right arrows. Toggle Common Sample Rate to Off to set different sample rates for each sensor.

    Tip: The configuration window indicates the amount of time that the sensor can log data below the sample rate. To increase the logging time:

      • Decrease the sample rate.
      • Disable unused sensors.
  5. Optional: Toggle Sensor Button Deferred Logging to On to start data logging by pressing the power button on the sensor.
  6. Click OK.

Data logging begins immediately after you click OK or press the power button on the sensor (if you selected Sensor Button Deferred Logging). The Bluetooth status light blinks yellow and green until data logging begins. When the sensor starts logging data, the Bluetooth status light blinks yellow.

Click OK and close SPARKvue. To stop data logging, turn off the sensor or connect it to SPARKvue to download the data.

Download remotely logged data

Download data remotely logged on a Wireless Sensor for data analysis. You can download the data to multiple devices as long as data isn’t deleted from the sensor after downloading it.

  1. Open SPARKvue or click then select Start New Experiment.
  2. Click Remote Logging .
  3. Turn on the sensor or press the power button if the sensor is currently logging.
    Note: The sensor doesn’t appear in Wireless Devices when the Bluetooth status light blinks yellow. Press the power button to make the sensor appear.
    Tip: Connect the sensor using USB, if available, to download data at a faster rate.
  4. Select the sensor under Sensors with data.
  5. In the Logged Data window, select Download Data.
  6. Select a method to download the data:
    • Templates
      Use this method to download the data into a new file.

      1. In the Select Measurements for Templates panel, select up to three measurements to display.
      2. In the Templates panel, select a template or a Quick Start Experiment to display the selected measurements.
    • Quick Start Experiments
      Use this method to download the data to a new Quick Start Experiment file. Names of Quick Start Experiments appear if available for the connected sensor.

      Select a Quick Start Experiment from the list, if available.

    • Add to existing experiment
      Use this method to download the data to an existing experiment file.

      1. Click Open PASCO Experiment or Open Saved Experiment.
      2. Select a file to open.


SPARKvue 4.0

SPARKvue makes data collection and analysis easier than ever before with cross-platform compatibility on Chromebooks™, iOS, Android™, Windows®, and Mac®, or on our standalone datalogger, the SPARK LXi.

Why SPARKvue?

SPARKvue makes data collection, analysis, and sharing quick and easy on every platform. Compatible with all of PASCO’s wireless and PASPORT sensors, students can quickly set up their lab, or use a built-in Quick Start Lab and begin collecting data immediately. SPARKvue is for all sciences and grade levels. However, if you’re an advanced user looking for more capabilities such as video analysis, advanced statistics and calculations, and greater customization of data displays on a PC or Mac®, then check out our PASCO Capstone™ software.

Since SPARKvue was first released, it has been winning awards, and we never stop improving it. With the latest major release of SPARKvue 4, we’ve continued to add features without adding complexity. A new Welcome Screen makes it easy to get started and discover SPARKvue’s capabilities. Whether you want to add data manually, use sensors for real-time or remote logging, or open one of the hundreds of existing labs, this is your starting place.

SPARKvue Landing Page Example

Data Collection

Using a USB or an interface, with SPARKvue you can just plug-and-play with nearly one-hundred sensors via Bluetooth®, which pairs wireless sensors through a simple in-app list (no system settings are required). PASCO understands that classrooms and labs can be hectic, so SPARKvue allows you to simply select a sensor from the sorted list (the closest sensors are first) and match a 6-digit laser-etched ID number to get connected. This method works even when there are dozens of Bluetooth sensors in the same lab.

Once you’ve selected a sensor, choose from a template or QuickStart Experiment, or you can build a page to meet your needs. SPARKvue is designed for inquiry, and students are not constrained to a few pre-selected layouts… the software can support expanding capabilities with ease.

SPARKvue Connection Screen Example
SPARKvue Template Screen Example

Collecting and visualizing data is easy with an array of displays, and the tools you need for analysis are right at your fingertips. Students can annotate data, apply curve fits, compare runs, create calculations, and much more! In-context tools make it simple to find what you’re looking for, which means that students spend their time learning the science, not the software.

SPARKvue Data Screen ExampleWhether you’re teaching K–8, high school, or college students, SPARKvue has the displays and tools you need to collect and analyze data. The basics you’d expect (such as digits, meter, graph, and table) are all included, but you will also find FFT, bar graphs, map display, embedded assessment questions, video playback, image capture, and analysis, as well as space for text and images. The labs you can build are only limited by your time and creativity.

Data Sharing and Export

When it’s time for students to submit their work, SPARKvue supports a variety of formats, and its export tools make it easy for educators. Students can easily snapshot their work in SPARKvue and submit an image, export the data to a .csv file to work in a spreadsheet, or save it in our .spklab format when they can come back and do more work in the future. SPARKvue also supports many other apps for saving or sharing data, including Google Drive on Chromebooks™.

SPARKvue Sharing Screen ExampleIf students are collaborating on a lab activity across devices, they can set up a shared session and stream results in real-time. Then, when the session is over, each student will have a copy of the data to analyze independently. These sessions can be set up in seconds within a student group, or the entire class can share the data from a teacher demonstration.

SPARKvue Data Screen Example

Data Collection

  • Live Data Bar: See sensor readings before you start sampling.
  • Periodic sampling: Automatic sampling proceeds at a fixed rate.
  • Manual sampling: Saves data only when a user specifies.

Data Displays

  • Graph, including multiple plot areas and axes.
  • Digits
  • Meter
  • Data Tables
  • FFT
  • Map Display
  • Bar Graph
  • Weather Dashboard (when used with the Wireless Weather Sensor with GPS)

Analysis Tools

  • Scale-to-fit: Adjust axis for optimal view of the data.
  • Data Selection: Easily select a portion of the data for analysis.
  • Prediction Tool: Visualize a prediction alongside the data.
  • Smart Tool: Find data point coordinates and calculate delta values.
  • Calculations Tools for Statistics: Easily get basic statistics (min/max/mean) and more.
  • Slope Tool: Find the slope of a point.
  • Curve Fits: 10 different curve fits with goodness of fit values.
  • User Annotation: Easily add text annotations to runs or points.
  • Easily add a y-axis or a new plot area.
SPARKvue Data Collection Example

Designed for Science Learning

  • Convenient annotation, snapshot, and electronic journaling are among the features that support peer dialogue, classroom presentations, and assessment.
  • Create and export electronic student lab journals.
  • Integrated with cloud-based file-sharing services such as Google Drive, Dropbox, and more.

The Same User Experience Across:

  • Computers
  • Chromebooks™
  • Tablets
  • Smartphones
  • PASCO dataloggers

More Features

SPARKvue Graph Data Screen

Graph data from a sensor & see the results in real-time.

SPARKvue Meter Screen

A Bar Graph used to investigate absorbance.

SPARKvue Boyles Law Screen

Boyle’s Law using both manually entered & sensor data.

SPARKvue Weather Dashboard Screen

Weather dashboard to monitor atmospheric conditions.

SPARKvue Choose a Path Screen

The new entry screen makes getting started even easier. Choose from three entry paths.

Download:

Download the latest update or give it a try for free.

Windows® Computers

  • Filename: SPARKvue-4.3.0.10.exe
  • Filesize: 250.32 MB
  • Version: 4.3.0
  • Released: Dec 13th, 2019

Download Free Trial Download Update

Mac® Computers

  • Filename: SPARKvue-4.3.0.10.dmg
  • Filesize: 132.67 MB
  • Version: 4.3.0
  • Released: Dec 13th, 2019

Free Apps for iPhones, iPads, Android tablets and Chromebooks

These SPARKvue apps provide the complete software install so that the user experience is the same regardless of platform. Updates for these apps are handled via direct notification and installation on your device, including SPARK LX/LXi users.


System Requirements

Windows
  • Windows 7 SP1 or later
  • Processor: 2 GHz or greater
  • RAM: 2 GB or greater
  • Disk Space: 459 MB or greater
  • Resolution: 1024 x 768 or greater
Mac
  • Mac OS X v 10.11 or later
  • Processor: 1 GHz or greater
  • RAM: 2 GB or greater
  • Disk Space: 202 MB or greater
  • Resolution: 1024 X 768 or greater
Chromebook
  • Chrome OS v70 or later
iOS
  • iOS v9 or later. Compatible with iPhone, iPad, and iPod touch.
Android
  • Android v5.0 or later. Compatible with tablets or phones.

About The Free Trial

  • This is a fully-functional 60-day free trial of SPARKvue software for Windows or Mac Computers.
  • After the 60 day trial, a licensed version of SPARKvue will be required to continue.
  • The full version of SPARKvue is also available as a free app for iPads, Android tablets, and Chromebook devices.

The View From a Small Town Physics Classroom

Let me paint you a picture. Not something physicists normally do but I’ll give it a shot.

I teach in a small town in BC. For most of my career it has been lower on the social-economic scale, a true blue-collar place but things are changing. More and more people are being pushed out of the big cities due to high house prices and ending up here where life is more laid back, more affordable, more idyllic?

Again, for most of my career the supplies I have had access to are the same supplies that came with the school when it was built…back in the 1950s. Trying to modernize my lab has been a challenge but just like the city, things are changing.

I’ve used PASCO products since my university days and have always found them to be intuitive and practical. When I had the chance, I purchased some of their GLX data loggers for demo purposes. I started to show the students the power of probeware and they yearned for more. Yes, I used yearn to describe students. I know, almost unheard of.

When I procured the funding to buy a class set of the GLXs after buying one a year for 5 years I was ecstatic. I called PASCO to order and was told that they were discontinued. I was bummed. What now? They told me about their new product, the Spark LX as a tablet data logger. I was intrigued. Many discussions happened, and I started to get on board. PASCO even took some of my suggestions about what I thought the logger should entail. After months of waiting they finally arrived; just in time for the start of a new school year.

I happily got to setting them all up and preparing their first interactions with the devices. I would use the Match-Graph software to give my physics students some hands-on real life to graph interactions. After a few hiccups of the airlinks needing firmware updates which my school computer wouldn’t allow I had the students head out into the school to test out the Spark and the software.

The looks we got from the other students and staff started as bewilderment. “What is his class up to now?” was heard more than once. My students didn’t even hear. They were too engaged to notice. The beginner graphs which were too hard mere seconds ago were now too easy. Harder graphs please. Harder and harder they went and the more competitive they got. “I’m addicted to this!” one student exclaimed. “I get it now.” Yelled another. They were hooked at first use.

I can’t wait to see how the next experiment goes. This is how technology should work in class. Relating physical experience to life experience to learning.

____
Glenn Grant has been teaching physics, math and science for 20 years in a small town called Mission, BC. 
“For most of my career I’ve been using equipment from the 1960s. I was the first person in my district to start using a Smart Board and then started getting into sensors about 10 years ago.  Since then I’ve cobbled together whatever I can to give my students access to something from the current century.  I believe that technology has a place in the classroom as a tool to further the learning.  Using the new PASCO equipment we can do labs 100 times a class and the discussion becomes more in-depth.  Why did they choose the data set they are using?  What makes that data “better”?  Can you replicate the graph on the board using the equipment.  It allows for more actual science than just content memorization. As I deepen my understanding of the equipment and its uses, I’ve been teaching the other members of my department and other teachers in the district.  I’m not an expert yet but I’m working on it.”

ONE SENSOR, MANY POSSIBILITIES

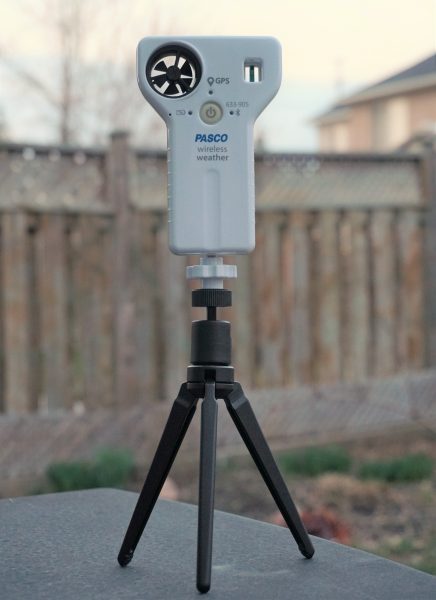
Earlier this year PASCO released a new Wireless Weather Sensor. It collects temperature, humidity, UV, wind, and more. The sensor also has a GPS! The folks at PASCO then embedded ArcGIS into their SPARKvue software that manages the sensors and allows for data analysis and visualization. Of course you can always export your data and load into a map at ArcGIS.com.
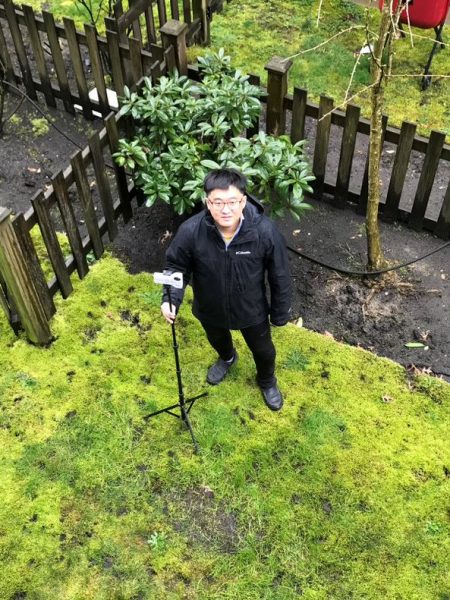
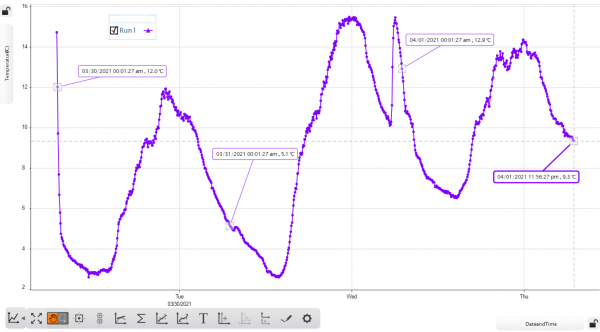
The all-in-one instrument can record up to 17 different measurements individually or simultaneously! Use the sensor in logging mode with the optional Weather Vane Accessory for long-term monitoring, or use it as a hand-held instrument to study microclimates and record ambient conditions relevant to many biological and environmental phenomena.
The Wireless Weather Sensor covers a wide range of protocols including:
  • Air Temperature
  • Barometirc Pressure
  • Water Vapor
  • Relative Humidity
  • Surface Ozone
  • Aerosols
  • Biometry
  • Lilac Phenology
  • Seaweed Reproductive Phenology
  • Hummingbird Project
  • Phenological Gardens
  • Land Cover Sample Site
  • Fire Fuel
  • Mosquito Larvae Protocol
  • GPS
Save & Share Cart
Your Shopping Cart will be saved and you'll be given a link. You, or anyone with the link, can use it to retrieve your Cart at any time.
Back Save & Share Cart
Your Shopping Cart will be saved with Product pictures and information, and Cart Totals. Then send it to yourself, or a friend, with a link to retrieve it at any time.
Your cart email sent successfully :)