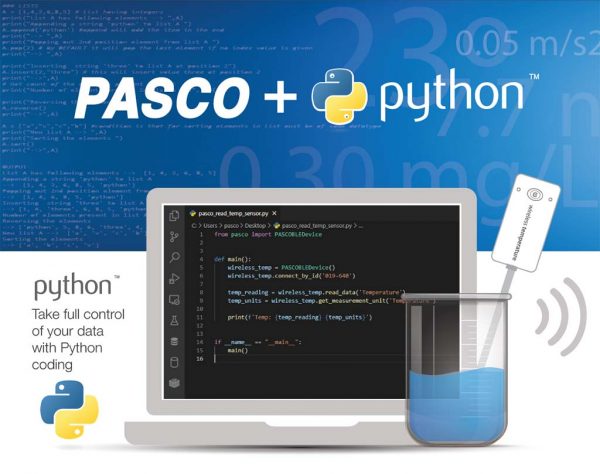
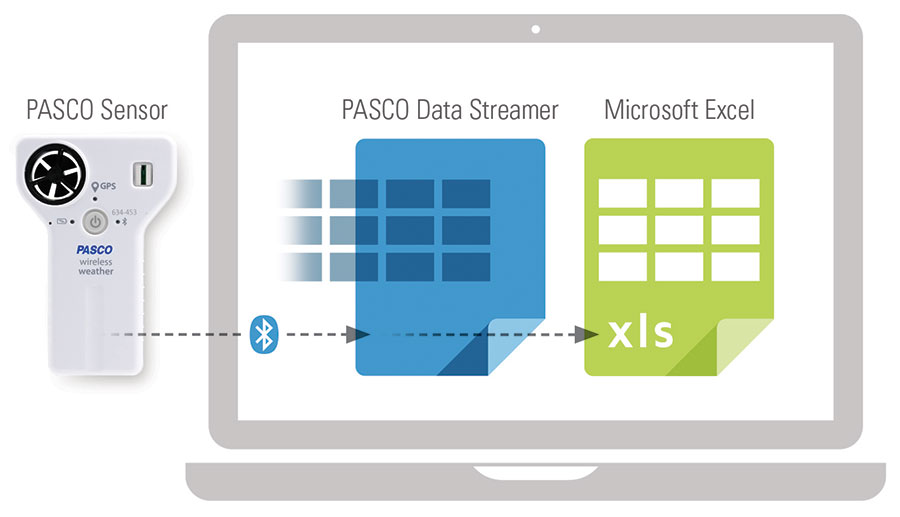
Stream data from PASCO Wireless Sensors directly to Microsoft Excel with the PASCO Data Streamer app
The PASCO Data Streamer app enables Windows® 10 users to stream real-time data from PASCO Wireless Sensors into Microsoft® Excel. All that’s required is a compatible PASCO Wireless Sensor, the PASCO Data Streamer App, and the Office 365 Excel® Data Streamer Add-in.

1 Download the Windows® App
Install the PASCO Data Streamer app for Windows® 10 by opening the Microsoft Store on your Windows computer and searching for PASCO Data Streamer.
The Windows® app is free. Visit the app’s product page in the Microsoft Store »
2 Download the Excel Add-in
Download the Microsoft® Excel Data Streamer Add-in using your O365 subscription.
Don’t have a subscription? Click here to get free access to Office 365 Education for you and your students.
For complete installation information, please visit the PASCO Data Streamer Help Guide.
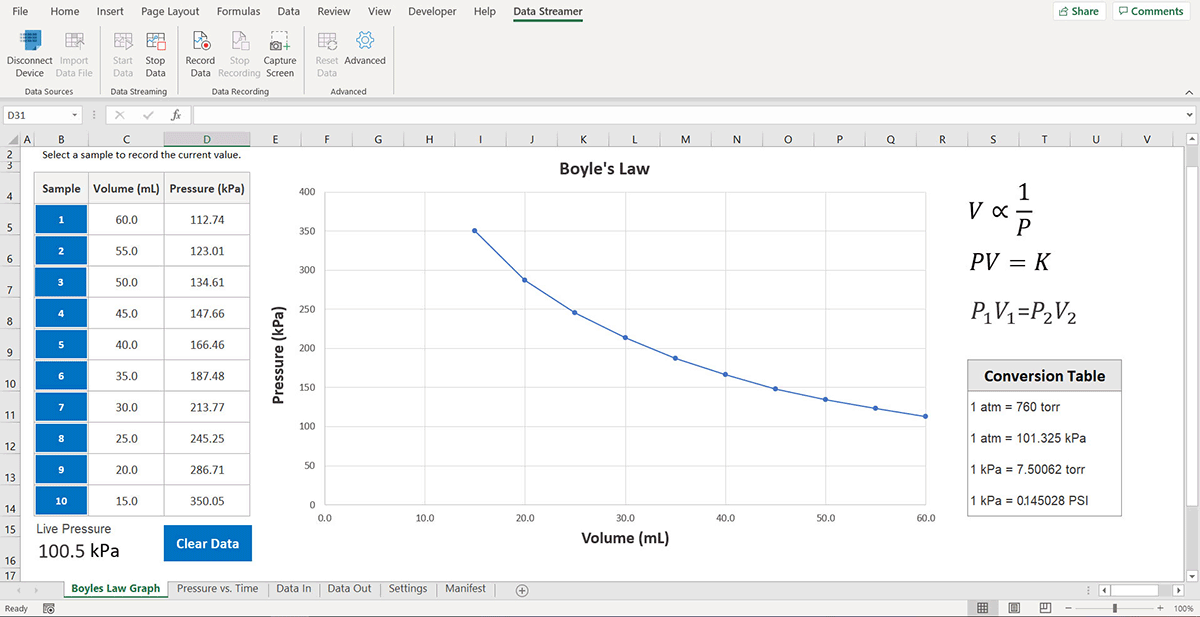
Boyle’s Law Sample Excel Workbook
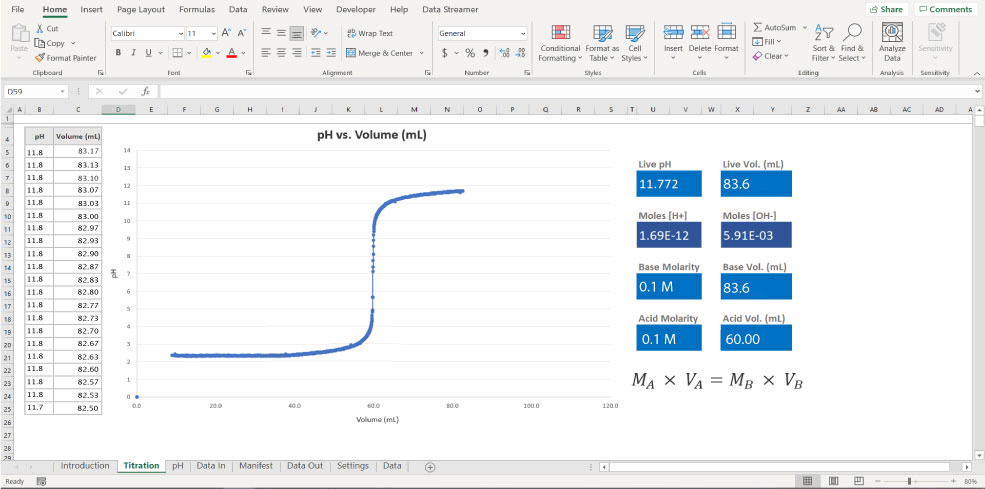
Acid Base Titration
Excel Workbook
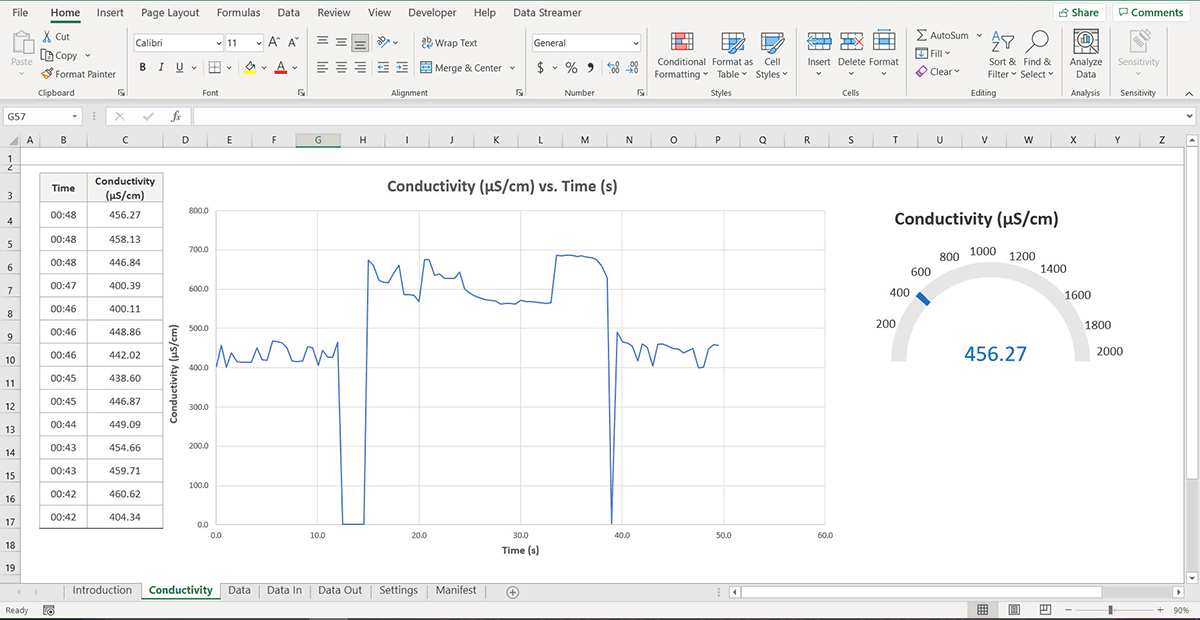
Conductivity Sensor
Excel Workbook
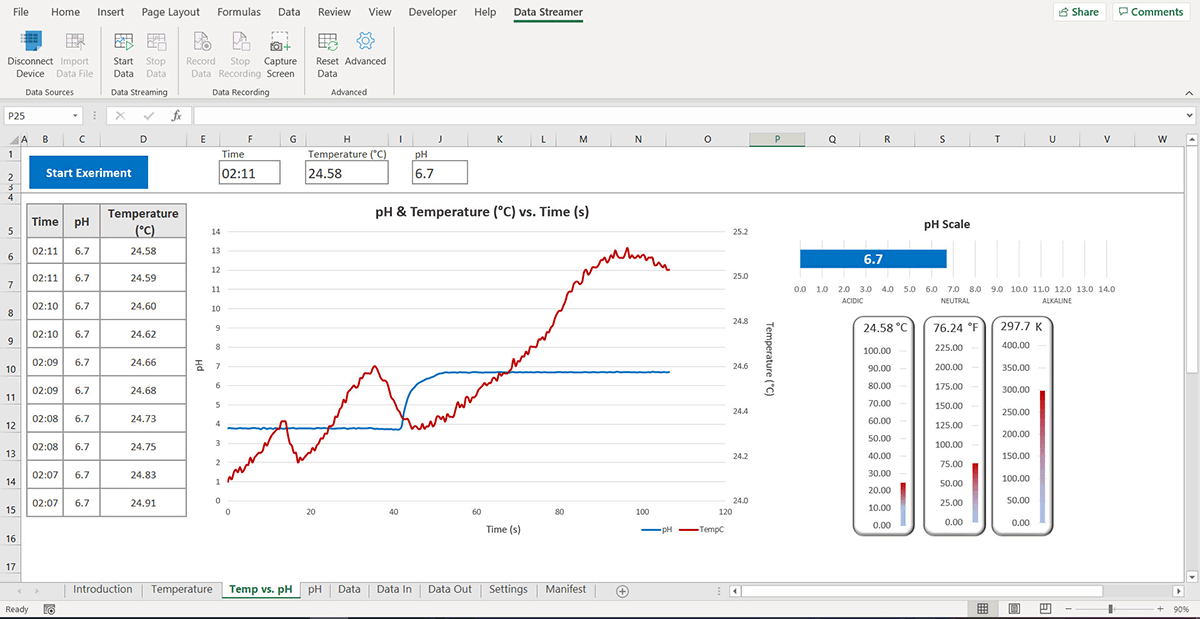
pH & Temperature Sensors
Excel Workbook
The following PASCO Wireless Sensors can be used with the PASCO Data Streamer app:
- Wireless Acceleration/Altimeter
- Wireless Blood Pressure Sensor
- Wireless CO2 Sensor
- Wireless Conductivity Sensor
- Wireless Current Sensor
- Wireless Current Sensor Module
- Wireless Diffraction Scanner
- Wireless Drop Counter
- Wireless Force Acceleration Sensor
- Wireless Light Sensor
- Wireless Load Cell and Accelerometer
- Wireless Magnetic Field Sensor
- Wireless Motion Sensor
- Wireless Optical Dissolved Oxygen Sensor
- Wireless Oxygen Gas Sensor
- Wireless pH Sensor
- Wireless Pressure Sensor
- Wireless Rotary Motion Sensor
- Wireless Temperature Sensor
- Wireless Temperature Sensor Link
- Wireless Voltage Sensor
- Wireless Weather Sensor with GPS
 Extension: Vector Display
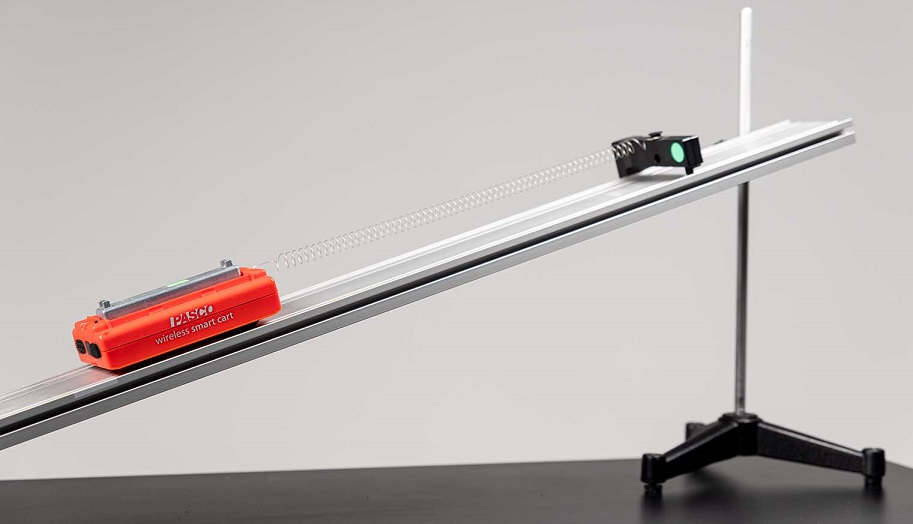
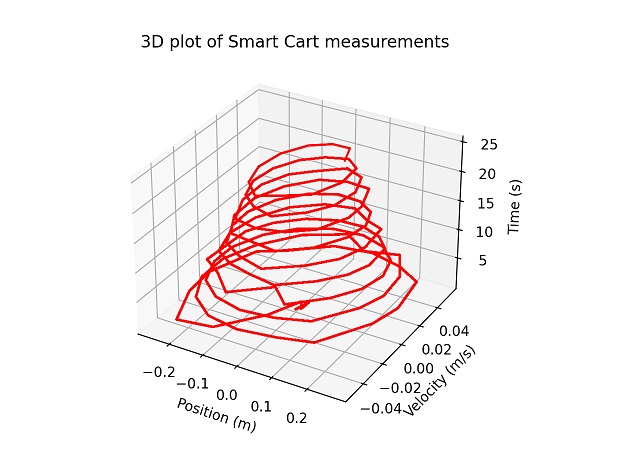
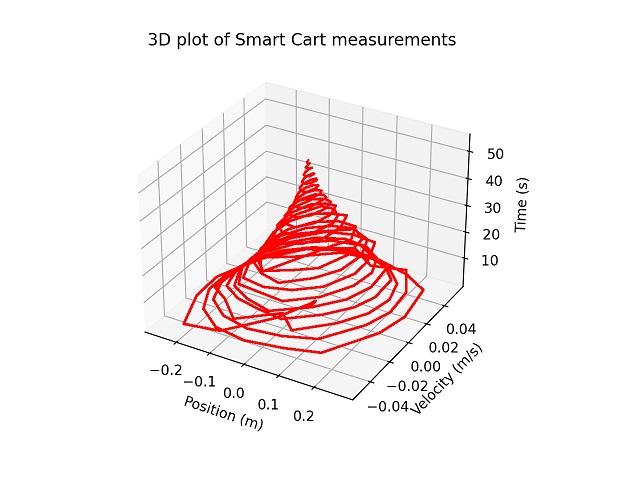
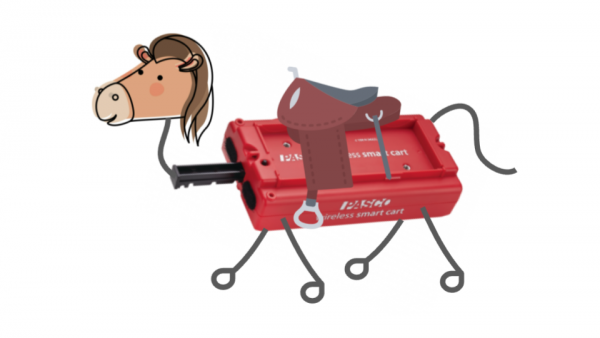
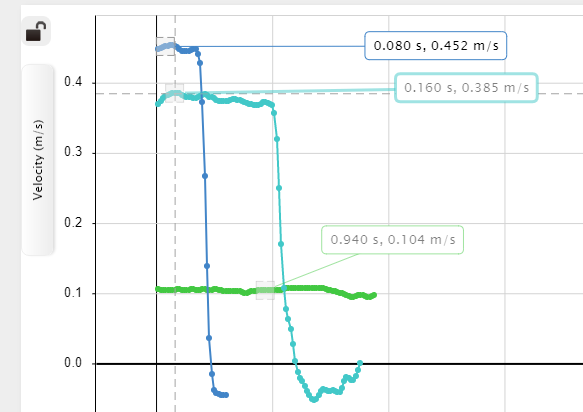
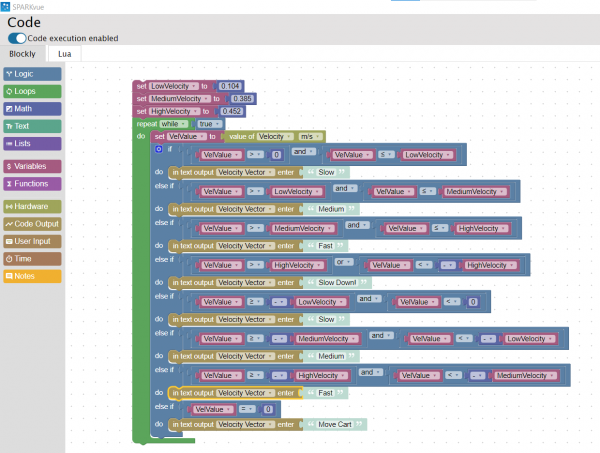 the ones I recorded, as shown in the image on the left. I tested my code by clicking start and moving the Smart Cart. At first, I was not sure where to look for the displayed text. I realized I had to change my display from a graph to digits. Then, by clicking the variable being displayed, I switched from Sensors to User-entered and chose Velocity Vector (the variable I created in the Blockly code). This time when I pressed start, the vectors I assigned to each velocity displayed on the screen depending on the Smart Cart’s speed. I decided to change the text displayed from vectors to words. As shown in the video below, I used simple terms such as slow, medium, and fast to describe the carts’ velocities.
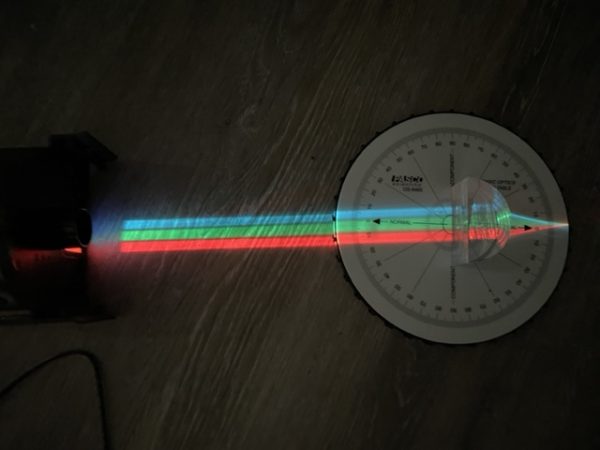 we used the Ray Table, the D-Shaped Lens, and the Light Source to perform a simple refraction experiment, using the PASCO Refraction lab as guidance as shown in the image on the left. This experiment was very easy to set up. All you need to do is plug in the Light Source and follow the instructions in the Refraction lab document. This experiment explores Snell’s Law, describing the relationship between angles of incidence and refraction.
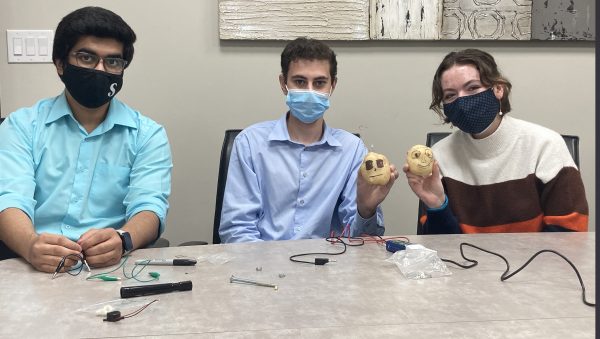
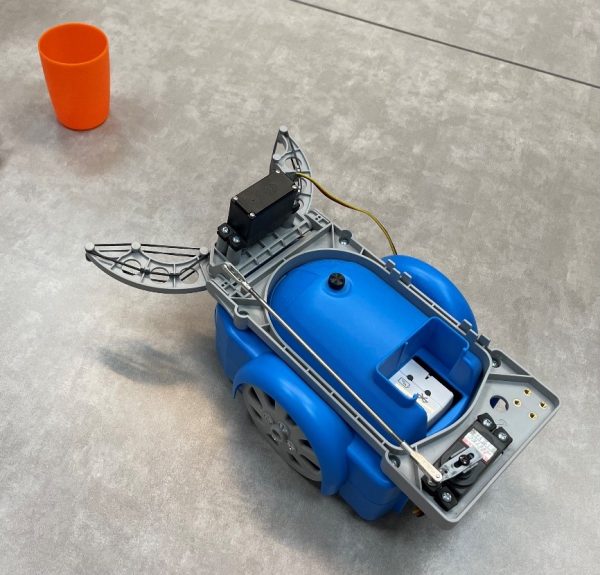 The first attachment we tested was the Gripper, shown in the photo on the left, which consists of two servo motors which attached to the //control.node. These motors allowed the Gripper to open and close its jaws as well as angle them up or down according to the given code. This was an interesting experiment that demonstrated several experimental applications of the PASCObot. For instance, setting up the code was quite simple. In the instructions, it explains how to get started with SPARKvue. The //control.node connects to the software using Bluetooth. The code is presented in a block-like manner, each instruction being in the shape of a puzzle piece. All you have to do is drag one of the puzzle pieces from the Code tool or import them from the PASCO code library, connecting them from top to bottom in the order you want them to function. Each block/puzzle piece states exactly what you want it to do. For example, to make the PASCObot move forward 50 cm, you would select the block “moveADistance with: _ cm” from the PASCO code library and type 50. Students may need a demonstration on how to navigate the code tool however, we were able to figure it out quickly, without having any previous experience with SPARKvue.
 This inspired us to film a short clip in which the PASCObot would move a certain distance, turn left, grab a cup of water, turn right, and bring this cup to us. We started by measuring and marking a course then coding the robot using the measurements taken, as shown in the image on the right. We were able to successfully complete this task without spilling any water, and this allowed us to become more familiar with the system.
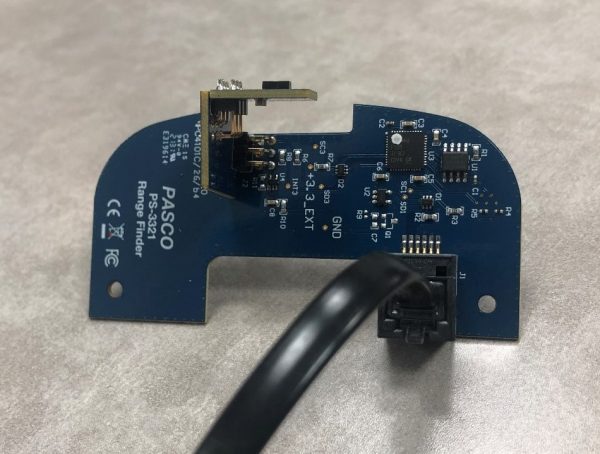 We then moved on to using the Range Finder Module, shown in the image on the left. This accessory was attached in the front of the PASCObot with two screws. A wire was then used to connect the Range Finder Module to the //control.node. The Range Finder Module uses infrared light to detect the distance from the PASCObot to objects. We followed the “Roving with Sight with the PASCObot” experiment from the PASCO Experiment Library and used the sample code. The code allowed the PASCObot to move on its own, avoiding objects, reacting to its surroundings, and maneuvering around the office floor independently. We found working with the PASCObot super cool and we are excited to try out more experiments.