English Français

1-877-967-2726

An Experiment Across Canada: How to Connect With Students Through Online Learning

Do you remember when in class teaching was considered standard, and a 6-feet social distance rule was not in place? A time before Zoom lectures were the new normal, and hands-on learning was encouraged in the classroom? With socially distant, hybrid, or virtual learning becoming a routine for teachers and students, it’s important that we find ways to incorporate student engagement in STEM courses.

I am a second year Environmental Sciences student at the University of Guelph currently in the Co-operative Education stream. I had the great opportunity to work for AYVA Educational Solutions for my first work term. As 2021 continued, I began to wonder, what would the effects of Covid-19 be on student involvement in STEM education? It was at this time, that I paired up with Ross Sun, a high-school teacher in the province of British Columbia. Ross is a great believer of hands-on learning techniques being accessible to students, even from remote settings. He has a YouTube page called ‘Mr. Sun STEM Education’ that focuses on providing virtual material for his students, with many of his videos including PASCO equipment such as the Smart Cart Dynamics System.

“Hands on learning in the modern society (especially right now) not only refers to making things by hands but also using technology. In fact, during this pandemic time when we try to limit traditional hands on activity/lab, using technology becomes the #1 alternative […] And that includes but not limited to virtual labs, video analysis, programming, making videos, and the use of sensors which can output data to be shared such as PASCO sensors.”               – Ross Sun

In order to investigate ways that teachers and students can interact virtually, while still maintaining high levels of curiosity and investigation in the classroom, the two of us were able to conduct a three-day long experiment using PASCO wireless weather sensors.

The weather sensor is an all-in-one device for monitoring environmental conditions and has the ability to measure over 17 different factors simultaneously, including temperature, humidity, light, and pressure. Being an environmental student, this sensor was perfect for the type of experiment we were hoping to conduct. The two of us were able to create a project that would analyze and compare the weather in Ontario and British Columbia. Over the course of 72 hours, starting on March 30th and going until April 1st, two weather sensors tracked and calculated the temperature and relative humidity in both locations. The free SPARKvue app available to mobile devices was able to connect with the sensor to begin logging. PASCO’s remote logging option was a great feature to use because once the sensor was connected, you could take your phone anywhere without it disrupting the sensor from recording data. This made the experiment extremely easy to complete without constantly monitoring the device.

Both sets of data were then downloaded to the SPARKvue desktop software where weather trends were compiled into graphs. The mentioned graphs can be seen below where it is very noticeable that the particular region in British Columbia, where this investigation was conducted, contains stable waves of increasing and decreasing temperature and relative humidity. In contrast to this, the temperature and relative humidity recorded for Southern Ontario is much more sporadic with a less consistent pattern.

The graphs above show the recorded data sets for relative humidity (right) and temperature (left) for the east coast of British Columbia. The trend shows large changes in temperature of the 72 hour period with consistent waves being formed. The first recorded data set for each day is represented by a connecting box with the date and time.

The graph above shows the recorded data sets for relative humidity (right) and temperature (left) in Southern Ontario. In contrast to the data recorded for BC, there is no clear pattern of increases and decreases in temperature and relative humidity. The temperature is on an overall trend downward with sudden small changes throughout the days. The relative humidity shows several irregularities and spikes throughout Thursday. The first recorded data set for each day is represented by a connecting box with the date and time.

This experiment is an example of how easy it is to combine inquiry-based and hands on learning with remote teaching practices. Using the SPARKvue Shared Sessions, teachers and students can collaborate online with real-time data, where each student has the ability to manipulate and examine the data collected.

Exploration and curiosity is one of the most important elements for students advancing through the secondary school level. This crucial time is when many students consider their professional careers beyond high school, and make informed decisions on the type of post-secondary path they want to follow. The PASCO wireless sensors are an excellent option for providing students with the freedom to explore backgrounds in STEM, even from the safety of their own homes.

Resources:

Wireless Weather Sensor

Increase Student Engagement with Virtual SPARKvue Labs

One of the hardest things about teaching online during this pandemic has been ensuring student engagement.  When my physics class moved online, I knew I wanted to somehow continue the lab component but wasn’t quite sure how… until I learned about shared sessions in SPARKvue.

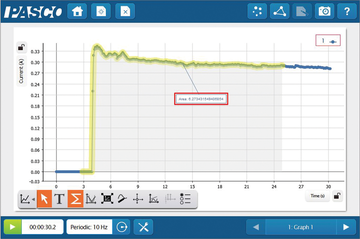
Without a doubt, remote labs were not going to be as hands-on as they were in person, but students should still have the opportunity to engage in the other practical applications of labs like making observations and analyzing data.  A shared session in SPARKvue allows students to see data being collected in real time as if they were doing experiments themselves.  I recently used this feature for a circuit lab in my Physics class.

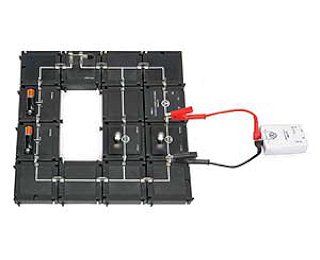
EM-3535 - Modular Circuits Basic

I set up a circuit using the modular circuits and pointed a webcam on it so the students could see the circuit I was building and manipulating.  I then started a shared session on SPARKvue and the students all joined in to see the voltage and current readings.  As I made changes to the circuits, I had students write various predictions in the chat of our meeting room.  The ability to predict and then see what actually happens in real time reflects what my students would do if they were engaging with this lab in person.

Doing this lab remotely not only allowed the students to predict, observe, and analyze; it actually opened up an avenue for more enriched discussions due to it’s collaborative nature and engaging the entire class at the same time.  When the data didn’t exactly match a prediction, I could point to aspects of the circuit through the webcam and connect what we were seeing to the data being shown.

The ability to predict, observe, and analyze is one of the key features of any science lab. By pairing a data collection program like SPARKvue with a webcam and the modular circuits kit (or other PASCO sensors), students can observe how data is being collected and engage in the process of scientific exploration of the concepts they would otherwise only see written on a page.  SPARKvue is changing not only the physical classroom but also the virtual classroom into a more engaging, thought-provoking, and dynamic environment for learning.

Resource

How to start a shared session in SPARKvue:

SPARKvue includes an easy & effective tool for hosting distance & hybrid labs!

Alternate text

With Shared Sessions, students can easily join a SPARKvue session hosted by their teacher – or even another student – from anywhere! They observe data collection in real time and keep a copy of the data to perform their own analysis.

Setting up a session is quick and easy and allows students to participate in a home lab using just their smartphone. Once the session is finished and students have completed their analysis, they can digitally submit their work using cloud services or the Journal Snapshot tool.

Mole Day

It’s that time of year again. Chemistry teachers everywhere are dusting of their pun-ny jokes and creating mole-themed, activities and treats to celebrate National Mole Day in commemoration of Avogadro’s number (6.02 x 10²³). Mole Day is celebrated starting at 6:02 am on October 23rd. How will we be celebrating? With chips and Guaca-mole, of course!

As we introduce the topic to students we typically start with something they already know. A mole, like a dozen, is a way of counting things. It just so happens that a mole is a really large number. While 1 dozen equals 12, 1 mole equals 6.02 x 10²³. This number has to be very large because the particles that we deal with in chemistry happen to be very, very small (or sm-ole… the bad jokes keep on coming).

To give students a mole-ecular perspective of those tiny particles, you can use a modeling kit.

At this point in the year it is important for students to understand the basics of chemical formulas. The model kit gives them something to see and touch as they learn that subscripts in a formula represent the number of atoms that are bonded in the compound.

In addition to formulas, the model kit can be useful in calculating molar mass. Since each different colored atom represents a different molar mass, students can just take their model and add up all the masses of all the atoms that they see! In the case of water, the oxygen is 16 grams per mole and each hydrogen is 1 gram per mole. In total, there are 18 grams for every one mole of water molecules.

So how do chemists relate these tiny particles to something that they can measure, like grams? Moles to the rescue! Avogadro’s number (the number of particles in one mole) and molar mass (the amount of grams in one mole) both meet in the middle at … moles.

Moles are central to counting particles in chemistry. Using Avogadro’s number and the molar mass of water, we know that there are 6.02 x 10²³ molecules in graduated cylinder that contains 18 grams of water.

Model kits can be great tools in helping students visually and kinesthetically learn about chemical formulas. They become actively engaged in the learning process as they discover the meaning and value of subscripts, molar masses and, of course, Avogadro’s number. And as students gain a better understanding of these concepts the real fun begins— they start to really understand your science humor! “Oh no! I’ve spilled water on my book!”

Happy Mole Day!

Experiment: How Hard is Your Tap Water?

Students use conductometric titration and gravimetry to determine how much calcium carbonate is in a sample of tap water.

This lab is an introduction to methodological comparisons. Percent error is calculated for both gravimetry and titration. Samples of tap water from various locales are concentrated and analyzed for calcium content.

Student Files

  • 03_ACI_How_Hard_Is_Your_Tap_Water_S.docx
  • 03_ACI_How_Hard_Is_Your_Tap_Water_S.pdf

Standards Correlations

  • IB Topics
    • 1.4
  • AP Topics
    • SPQ-1.A; SPQ-2.A; TRA-1.C; SPQ-3.C; SPQ-4.A

Featured Equipment

  • Wireless Drop Counter
    • Use the new Wireless Drop Counter for more efficient and accurate titration data. Conducting a titration has never been easier!
  • Wireless Conductivity Sensor
    • This waterproof sensor connects via Bluetooth® to measure both conductivity (ionic content in solution) and total dissolved solids.

This experiment can also be run with previous versions of PASCO sensors.

Seven Great Experiments Using the Wireless CO2 Sensor

Measuring Carbon Dioxide (CO2) has many applications in the classroom and with the latest advances in technology is easier and more affordable than ever before. Here’s a quick look at some of the cool things you can do with the new Wireless CO2 Sensor!

1. Monitor Air Quality

An engaging way to introduce students to the sensor is to use the “closed” environment that you already have access to – your classroom or lab. This is also a great opportunity to use the data logging capabilities of the sensor. Find a central place in the room to place the sensor, ideally suspended above students heads where they can’t exhale onto the sensor. Place the sensor into logging mode, and collect 8-10hrs of data (Figure 1a). Depending on the student density in your room, HVAC, how closed the environment is, you should be able to see fluctuations in the CO2 levels that correspond to the class schedule because all of those students are busy breaking down glucose and producing CO2.


Figure 1a. Data from sensor logging over a school day.


Students can repeat this test in other locations such as the cafeteria, greenhouse, bathrooms, etc. While there are conflicting standards generally a CO2 concentration of <1,000ppm is desirable and >3,500ppm people will begin to experience physiological effects. Many modern HVAC systems even have their own sensors that will cycle the air to maintain CO2 levels <1,500ppm you can probably tell from the data if you your school or lab has one!


Figure 1b. Data with bell schedule overlaid


2. Investigate Cellular Respiration

With the included sample bottle students’ can use invertebrates, germinating seeds, or other small organisms to quickly collect respiration data. Variation in environmental factors like light or temperature provide easy extensions as well as germination time, species comparisons, body mass, activity level, etc.


Figure 2. Respiration of Germinating Seeds


Extending this setup the sensor can be used with bacterial or yeast solutions, even aquatic species by measuring the gas concentration in the headspace of the container.


Figure 3. Headspace Measurement above a liquid


While a smaller chamber will yield faster results (gas concentration will change faster) sometimes a bigger chamber is needed to study larger organisms or when modeling ecosystems. This is where the wireless design is particularly helpful, the sensor can easily be placed inside any container along with the organism being studied – without any modifications. If you need to run the sensor for longer than about 18hrs, connect it to an external USB power pack or source and the sensor can continue working.


Figure 4. Sensor inside a larger food storage container


3. Investigate Photosynthesis

To get great photosynthesis data you just need a fresh dark green leaf, the sensor, and the sample bottle. Put the leaf in the bottle, cap it with the sensor and start data collection! Using the sample bottle and a fresh leaf ensures a quick response – data runs of 5-10min! Light vs. Dark and wavelength are simple and relevant manipulations for students to conduct.


Figure 5. Photosynthesis using a single Epipremnum sp. Leaf with no filter, blue filter, red, and green applied. Plants exposed to full spectrum CFL bulb for 10min runs.


Test

CO2 Rate (ppm/min)

Light (no filter)

-17

Blue Filter

-7

Red Filter

-9

Green Filter

-12

Dark (tinfoil wrapped)

+32

Table 1. Summary of change in rate found from each run of data.


And more ideas (than I have time to test): Light intensity, impact of temperature, herbivory, time of day, herbicide impact, stomata density, C3/C4/CAM Plant comparison, CO2 Concentration

4. Measure Carbon Flux in the Field

In some cases lab experiments aren’t feasible or desirable. It’s easy to take the sensor into the field using a cut bottle, bell jar, or plastic bag to isolate a plant or patch of soil for analysis without disturbing the environment. Firmly press the container into the substrate to create a tight seal and begin collecting data. Students can easily compare different ecosystems to determine if they are a net carbon producer or consumer under conditions. This technique can be repeated in different conditions, times of the day or year to compare results.


Figure 6. Cut bottle with sensor place over patch of turf


This same technique combined with the concept of measuring a headspace over a liquid to determine the gas exchange can be used to monitor carbon flux in an aquatic ecosystem. Securing the sensor with a float (or to a fix object) to protect it creates the airspace needed to measure above the water. Collect data for the day to see how a body of water is exchanging carbon with the atmosphere.


Figure 7. Using a float and cut bottle to create an airspace and measure carbon exchange


5. Monitor Respiration of Soil Microbes and Decomposers

To streamline the sample collection and measurement of soil samples students can use a section of PVC to collect a consistent volume of substrate and make the measurement in the same chamber. A 6-8in (15-20cm) section of pipe with an inner diameter of ~1.125” (3cm) can be easily pounded into the ground a specified depth to collect the sample. Seal the end of the pipe with some parafilm or plastic wrap and collect the data.


Figure 8. Sensor in PVC tube with marking for soil sample depth, clear PVC used to demonstrate


Data collection can take place in the field or lab and is easily extended for inquiry. Students can treat the samples with pH buffers, water, drying, salt, pesticides, or other chemicals of interest to determine the impact on microbe respiration.

6. Measure Human Respiration

Using a drinking straw and a 1gal (4L) ziplock® bag its easy to capture human respiration data. Here’s a video comparing breath hold time. This same procedure can be used to test other variables, before and after exercise, time of day, etc.


7. Dissolved CO2 in situ

With Dissolved CO2 Sleeve students can monitor CO2 in an aquatic environment. The Teflon® material is permeable to CO2 molecules but not to water, creating a much smaller headspace around the sensor with a better response time. While the CO2 is not dissolved when its measured this approach has been validated and tracks with other indicators such as pH (Johnson et al 2010). This approach works well in the field and in the lab for photosynthesis and respiration experiments. Below is a picture and some data we collected during betta testing!

Reference:
Johnson, M. S., Billett, M. F., Dinsmore, K. J., Wallin, M. , Dyson, K. E. and Jassal, R. S. (2010), Direct and continuous measurement of dissolved carbon dioxide in freshwater aquatic systems – method and applications. Ecohydrol., 3: 68-78. doi:10.1002/eco.95

Related Products:

Exploring 2-Dimentional Motion and Vectors with Capstone’s Video Analysis Feature

Capstone includes a very powerful video analysis feature which can be used for comprehensive analysis of moving objects as well as to improve understanding.  Short video clips from your smartphone can be easily imported and analysed with a range of tools.  The movement of objects with a high contrast to a uniform background can be automatically tracked by the software.


A ball will be thrown in a parabolic arc and various tools will be used to analyze the motion.  Note that the vertical and horizontal axes have been marked and a distance of 4.00 m has been measured.  This will enable the software to translate from pixels to m:


As part of the analysis, the position of the ball in each frame is marked and the result is as shown below:

It is now possible to have the software generate various graphs such as position vs time and velocity vs time.

A graph of vertical position vs time is as shown below:

A graph of horizontal position vs time yields the following:

A graph of the vertical component of velocity vs time yields the following result:

Capstone also includes tools that improve understanding.  For example, in the screen below, the vertical and horizontal components of velocity are shown for the ball as it flies through the air.

To make the display less cluttered and less confusing it is possible to mark the vectors at an interval other than every frame.  Below the vectors are shown every third frame:

It is also possible to have a single vertical vector and a single horizontal vector appear and move with the ball as it goes through the air.


It is also possible to show the acceleration vector as shown below:

The fact that a few vectors do not point directly down is likely due to minor errors made when marking the position of the ball in various frames with a mouse.

PASCO Day of Physics – July 24, 2020

Session 1

Session 2

Session 3

Session 4

Session 5: Cool Physics Demos

  • Coupled Oscillators Smart Cart (FFT) & Friction Block+PAScar
  • Inertia Wands
  • Atmospheric pressure Demos
  • Polarizer Demo / Color Mixer / Color Mixer Accessory
  • Genecon Hand Crank Generator Coil & cow magnet on a spring
  • Eddy Currents – magnetic braking
  • Mirror pendulum demo

SPARKVUE – A resource for planning lessons during the pandemic!

With SPARKvue it is possible for teachers to collect data and steam the data to students in real time via a student device also running SPARKvue. This is possible if each device has SPARKvue loaded on it and is connected to WiFi – even if the devices are located many kms apart. So a teacher could schedule a zoom session with his/her students. Students could use a computer for this activity. The teacher could then carry out an activity on another device loaded with SPARKvue and stream this to students who would have a second device such as a tablet, chromebook or smart phone to receive the data. After using the zoom platform for some preliminary discussion the teacher could then turn control of the data over to each individual student and this student could then use all of the tools available to him/her in SPARKvue to carry out the analysis.

Has it been difficult for you to plan lessons for your students that would result in meaningful learning as they tackled them at home?

SPARKvue data collection software can be a great help here for several reasons:

  •  SPARKvue will run on a great variety of devices including smart phones, tablets, chromebooks, and computers. It is free for all of these devices except for computers, for which a license must be purchased.
  • The appearance and function of SPARKvue software is virtually identical ascross platforms.
    • An activity planned and carried out and saved on one device such as a tablet can be opened in another device such as a chromebook.
    • All of Pasco’s sensors can be used with any of these devices

  • Unlike the software of some of our competitors, it is possible to generate a number of pages in SPARKvue (actually there is no limit). This makes it possible to use a number of the displays available in SPARKvue such as a digital picture, a video clip, a graph, a table, a meter, a digital display, an assessment, a text box, and blockly coding.
  • A teacher could design and carry out an activity where most of the analysis is left for the student to complete. For example the sequence of pages could look as follows:
    • The opening page is a title page and gives a brief description of the task to be completed
    • Page 2 shows a digital photograph of the setup to be used
    • Page 3 contains a short video clip in which the teacher gives a brief explanation or where a specific technique is demonstrated – eg how to connect a pressure sensor to a syringe (for a Boyle’s Law activity).
    • Page 4 is a text box which informs students that a data run has been collected by the teacher and the following pages will instruct them how to analyze the results. For example on page 5 the page is split into two parts with the larger part on the left. Students are asked to generate a graph of the data. On the right side there are a number of questions which students must answer by analyzing the graph. This means that the students will have to know how to use the analysis tools found as part of the graph display.
    • On page 6 students could find another split page. Suppose a motion sensor was used to collect data. On the left side students could be asked to plot a graph of kinetic energy vs time. This means they would have to know how to use the calculator in SPARKvue. On the right side of the page there could be a number of questions relating to this graph.
  • SPARKvue can collect data from more than one sensor at a time. For example, an activity could be carried out in which the pH and temperature of a sample of orange juice is measured when AlkaSeltzer is added. Students could be asked to generate a graph showing both the temperature and pH of the juice as the reaction proceeds and then be asked a series of questions on this reaction.
    • As can be seen from the examples above SPARKvue can be used to carry out extensive analysis of collected data.

PASCO Wins Three “Best of Show” Awards from NSTA and Catapult-X

Wireless Smart Cart, Wireless Spectrometer, and Wireless Weather Sensor


We are pleased to announce that PASCO has been awarded three “Best of Show” awards! More than two thousand science and STEM educators participated in the first Science Educators’ Best of Show™ Awards by casting their votes for products that they felt impacted science learning. We are honored to have our products recognized in a competition designed by science educators for science educators. You can check out the winners below!

Category: Best New Technology Innovation for STEM
Winner: PASCO’s Wireless Smart Cart and Accessories
When physics educators combine the PASCO Wireless Smart Cart with the available accessories, they have a complete platform for demonstrating some of the toughest topics in mechanics. The Smart Cart’s ease of use and extensive capabilities allow students to perform their mechanics labs to a high degree of accuracy and repeatability. With sensors for position, velocity, acceleration, force, and rotation, the Wireless Smart Cart relays live data to help students test their understanding of mechanics in real time.

The wireless nature of the PASCO Wireless Smart Cart and Accessories is a definite improvement [over traditional systems]. The removal of wires needed to connect to an external interface makes data more accurate and opens up opportunity for more innovative experimentation. The accessories for the carts also are very innovative and extend the scope of investigation.

— Science Educators’ Best of Show Judge

Category: Best Tried & True Technology Teaching and Learning: Chemistry
Winner: The Wireless Spectrometer and Spectrometry software
With measurements for emission spectra, intensity, absorbance, transmittance, and fluorescence, the Wireless Spectrometer is surely more powerful than its size suggests. Its visual, user-centered design makes it easy for educators and leaners of all levels to integrate spectrometry into their learning. The key is PASCO’s Spectrometry software, which allows students to quickly generate standard curves, make comparisons, and analyze their results using its visual absorbance display. When combined, the Wireless Spectrometer and Spectrometry software provide educators with a classroom-friendly spectrometry solution that can be applied to a wide variety of chemistry topics.

This device provides advanced analysis potential of spectrum analysis for chemistry, environmental and physics classes that is quite rare for high school classes to experience. The data collection is quick and thorough with excellent software for analysis on many devices. Use of this device and software will enhance learning in many science courses.

— Science Educators’ Best of Show Judge

Category: Best Tried & True Technology Teaching and Learning: Environmental Science
Winner: The Wireless Weather Sensor and SPARKvue software
With more than nineteen different measurements, including GPS, the Wireless Weather Sensor supports real-world environmental investigations that relate phenomena to data collection and analysis within SPARKvue. Together, the Wireless Weather Sensor and weather features within SPARKvue create a coherent solution for performing both long-term and short-term environmental inquiry at any science level. The Weather Dashboard within SPARKvue intuitively displays live and logged data, while SPARKvue’s ArcView GIS mapping integration supports geospatial investigations and analysis.

This sensor would provide extra opportunities for data collection in environmental science. It does offer a variety of options for experimental situations-19 in all. Experiments can be of short duration or long term. The weather vane is mentioned as an extra device to enhance data collection.

— Science Educators’ Best of Show Judge


Save & Share Cart
Your Shopping Cart will be saved and you'll be given a link. You, or anyone with the link, can use it to retrieve your Cart at any time.
Back Save & Share Cart
Your Shopping Cart will be saved with Product pictures and information, and Cart Totals. Then send it to yourself, or a friend, with a link to retrieve it at any time.
Your cart email sent successfully :)