Coding with Blockly: Displaying a Smart Cart’s Velocity Vector
Today I got to work through an experiment using PASCO’s Wireless Smart Cart and Blockly code on SPARKvue. I followed the Blockly Extension: Vector Display lab from the PASCO Experiment Library. This lab guides you to use Blockly code to display text on the screen depending on the speed of the Smart Cart.
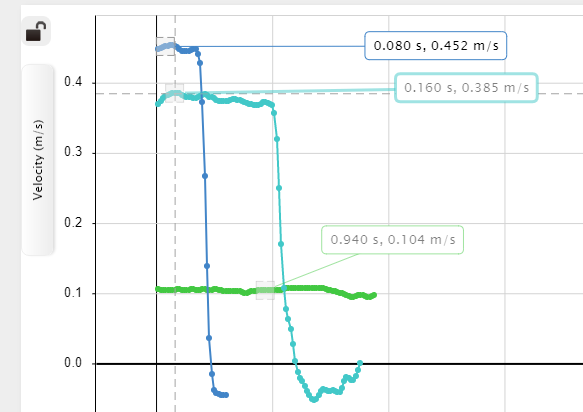
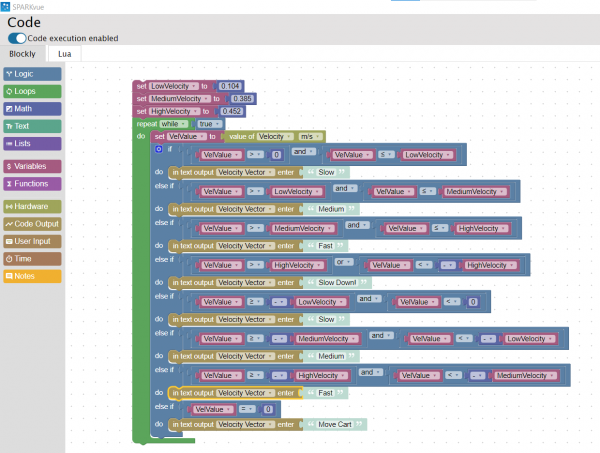
I connected the Smart Cart through Bluetooth to SPARKvue and read through the lab procedure. I started off by slowly moving the Smart cart along my desk while observing the velocity graph. I conducted three runs, one to determine a low velocity, a medium velocity, and a high velocity. I took note of these three velocities, as shown in the image on the right, so that they could be included within the code. After getting familiar with the lab, I copied the example code, adjusting the velocity values to  the ones I recorded, as shown in the image on the left. I tested my code by clicking start and moving the Smart Cart. At first, I was not sure where to look for the displayed text. I realized I had to change my display from a graph to digits. Then, by clicking the variable being displayed, I switched from Sensors to User-entered and chose Velocity Vector (the variable I created in the Blockly code). This time when I pressed start, the vectors I assigned to each velocity displayed on the screen depending on the Smart Cart’s speed. I decided to change the text displayed from vectors to words. As shown in the video below, I used simple terms such as slow, medium, and fast to describe the carts’ velocities.
I found this lab super cool! It was my first time experimenting with the Wireless Smart Cart using Blockly code and I am looking forward to coding more products.
